


Geographic atrophy (GA) is an advanced form of age-related macular degeneration (AMD), characterized by progressive degeneration of the choriocapillaris, retinal pigment epithelium (RPE), and photoreceptors. Atrophic lesions first start outside of the fovea and progress circumferentially, eventually growing to involve the fovea center, leading to irreversible central vision loss.1,2
There has been an increase in the need for an automated, precise, and clinic-ready tool to segment the area of GA since the advent of complement inhibitor therapies pegcetacoplan (Syfovre; Apellis Pharmaceuticals) and avacincaptad pegol (Izervay; Astellas Pharma). Previous groups have used clinical trial data to train and develop automated GA algorithms due to the quantity and quality of these scans.3 The GEODE study instead used real-world data derived from routine clinical practice and included eyes with GA and concurrent exudative AMD to more accurately represent typical GA patients.
Although fundus autofluorescence (FAF) and fundus photography can be used to assess GA, optical coherence tomography (OCT) has become the most commonly used diagnostic modality of choice because it is readily available in clinics and was proposed as the reference standard to diagnose and stage atrophy by an international consensus group.4 Existing approaches that use OCT primarily depend on generating a 2D en face view from the 3D volume prior to the segmentation of the area of GA.5 The strategy used in the GEODE study does not include this step and instead used a single neural network architecture to directly segment 3D volumetric OCT data. This approach avoids the need for preprocessing using layer segmentation, which reduces the noise and feature losses in the data.
Understanding the GEODE Study
The GEODE study is part of a multicenter analysis involving Retina Consultants of Texas (RCTX), Retina-Vitreous Associates (RVA), and Vitreous Retina Macula Specialists of Toronto (VRMTO). Images at RCTX were acquired using the Spectralis OCT device (Heidelberg Engineering) and were manually segmented for GA by an expert grader. Patients were classified as either “GA only” or “GA with other pathologies,” including concurrent neovascular AMD. A U-Net–based architecture using a 3D encoding path coupled with a 2D decoding path to produce the final segmentation was deployed using cross-validation to process the entire data set. For completeness, we additionally included the near infrared (nIR) images that are routinely acquired by the device as additional input to assess if performance would improve with this additional information.
Two variables were used to gauge the accuracy of the algorithm, the coefficient of determination (R2) and the Dice coefficient (DSC). The coefficient of determination compares the numerical values for the area, while DSC measures the overlap between manual and automated grading. A total of 163 subject eyes, with a mean age of 79 years and an average baseline best-corrected visual acuity (BCVA) of 0.64 logMAR, were included. The average R2 for Spectralis OCT scans was 0.906, and the average DSC was 0.826. Mai et al reported an average DSC of 0.86, which we used as our benchmark.3 We also noted that the addition of nIR didn’t impact the DSC meaningfully (DSC=0.829), indicating that this may not be a necessary modality.
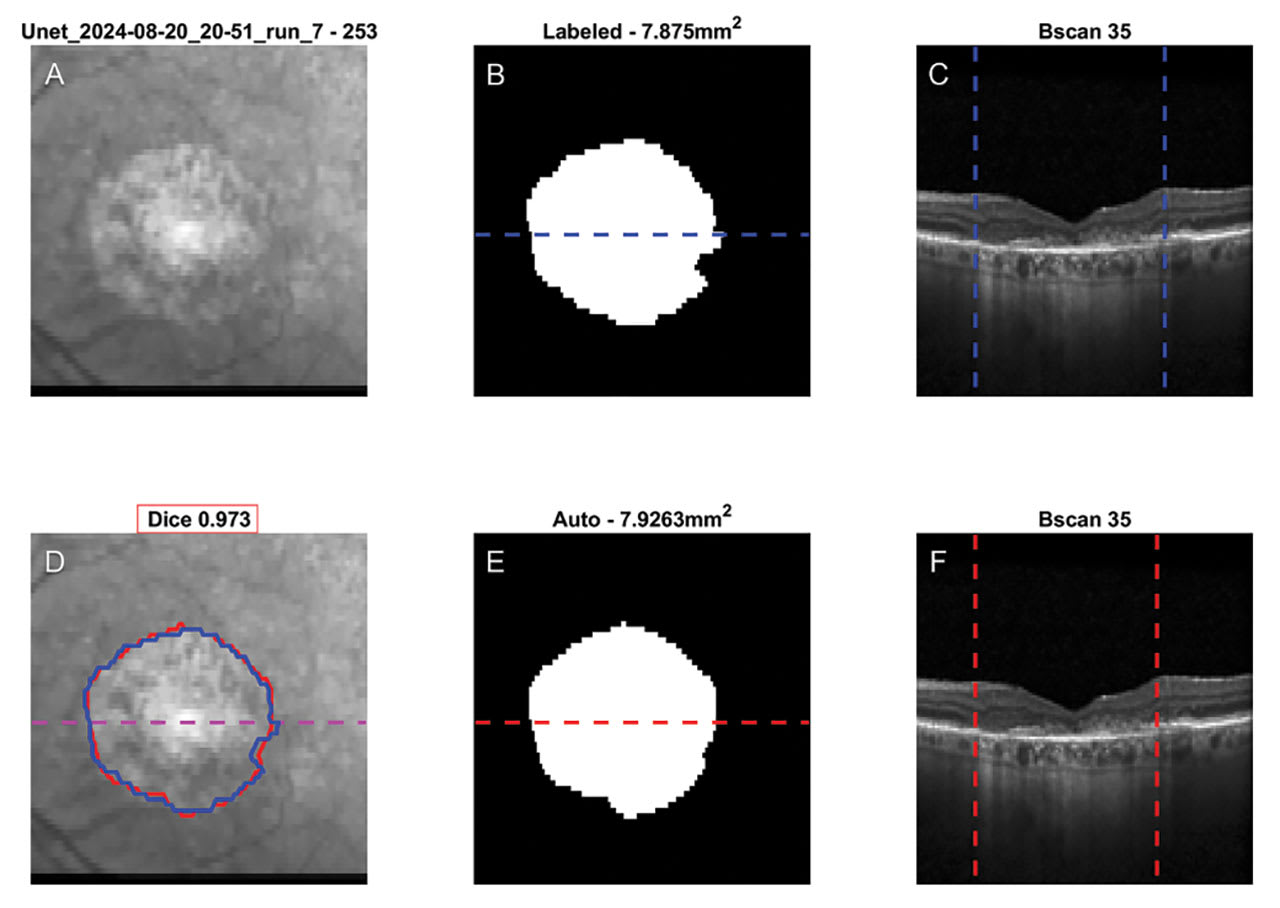
Figure 1. Example case depicting a near infrared (nIR) image (A, D), manual and automated segmented GA areas (B, E) and example B-scan (C, F). Manual and automated segmentations are overlaid on the nIR image in blue and red, respectively (D). DSC are outlined with a red border above (D). In the OCT B-scans, the vertical bars represent the extent of the manual and automatic segmentations, respectively, indicating the area of GA (C, F). Image courtesy Simrat K. Sodhi, MSc, MB BChir (Cantab).
Refining the Deep Learning Model
To further enhance the performance of the DSC in our analysis, we conducted a detailed investigation of the dataset to identify specific cases that were contributing to lower scores. By systematically reviewing individual cases, we aimed to pinpoint patterns or characteristics that could account for their diminished DSC values. Our evaluation revealed several examples of cases (shown below) that were disproportionately affecting the overall metric. These cases provided critical insights into the potential factors impacting the DSC, such as variations in data quality, segmentation errors, or inherent challenges in certain types of inputs.
In these cases, the output from the grader is shown in the top row, while the automated output is shown in the bottom row. The DSC is shown above the automated output with a red border.
In the first case (Figure 1), the presence of a well-defined and distinct border enables the algorithm to accurately delineate the area of interest. This precise segmentation is reflected in the high DSC value, which demonstrates substantial overlap and agreement between the manual grading and the automated output. This result underscores the algorithm’s effectiveness in cases with clear and easily distinguishable boundaries, highlighting its reliability under such conditions.
In the second case (Figure 2), smaller islands of atrophy increase the disagreement between the grader and algorithm. This is shown with a reduced DSC of 0.866. The automated algorithm is oversegmenting and not granular enough to accurately segment the smaller islands. This could be an issue of the scale used, but is more likely a result of the anisotropic nature of the scan pattern where the OCT volumes comprises far more data horizontally than vertically.
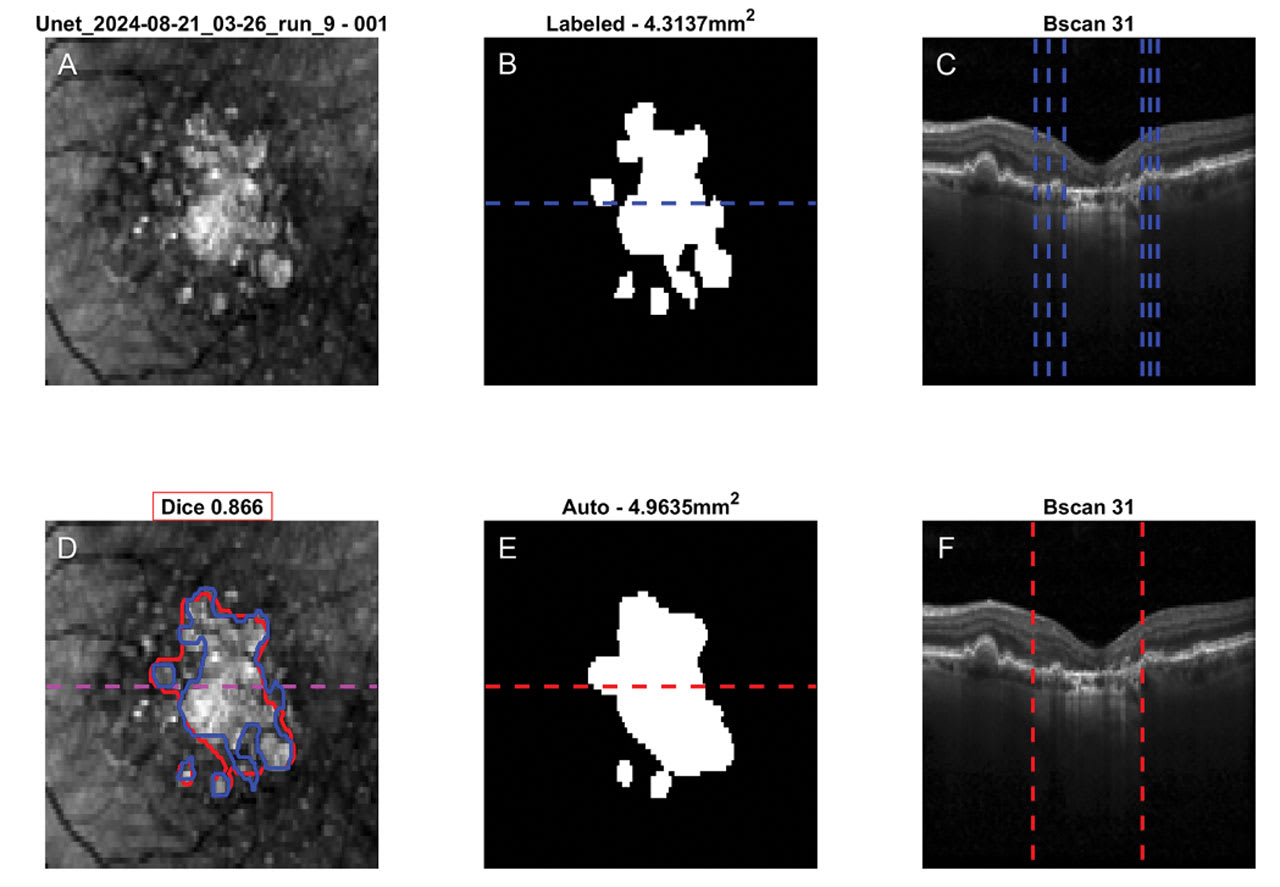
Figure 2. Example case depicting a near infrared (nIR) image (A, D), manual and automated segmented GA areas (B, E) and example B-scan (C, F). Manual and automated segmentations are overlaid on the nIR image in blue and red, respectively (D). DSC are outlined with a red border above (D). In the OCT B-scans, the vertical bars represent the extent of the manual and automatic segmentations, respectively, indicating the area of GA (C, F). Image courtesy Simrat K. Sodhi, MSc, MB BChir (Cantab).
However, if the area of the island of atrophy is larger, as in the third case (Figure 3), there is better correlation and the DSC increases (DSC=0.945).
As illustrated, detail can be lost in the segmentation performance, yielding lower DSC scores. In addition to continuous longitudinal analysis as well as repeatability and reproducibility studies, we also want to further investigate how to increase the precision of our algorithm in these specific instances. In subsequent analyses, we will also compare this algorithm across OCT devices to ensure its use is machine-agnostic.
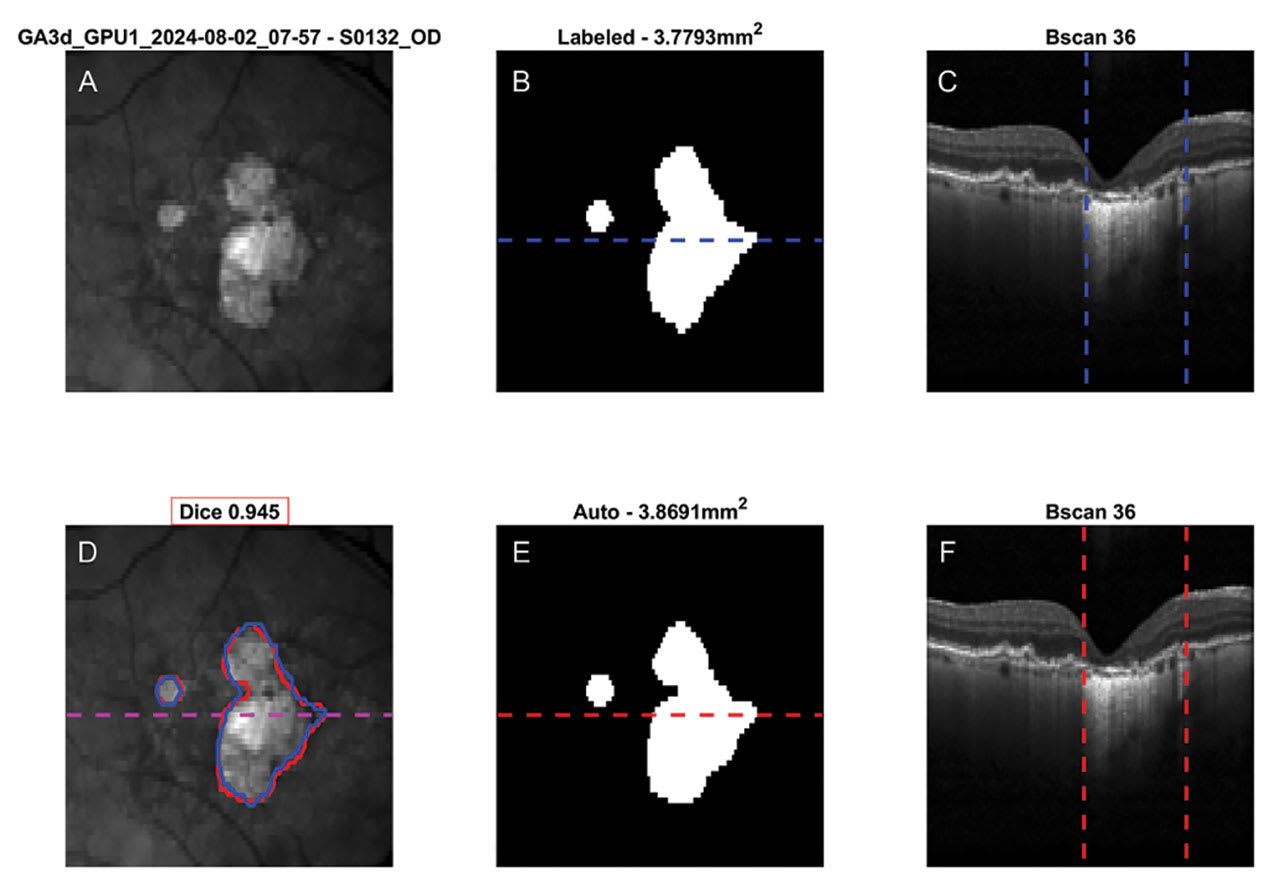
Figure 3. Example case depicting a near infrared (nIR) image (A, D), manual and automated segmented GA areas (B, E) and example B-scan (C, F). Manual and automated segmentations are overlaid on the nIR image in blue and red, respectively (D). DSC are outlined with a red border above (D). In the OCT B-scans, the vertical bars represent the extent of the manual and automatic segmentations, respectively, indicating the area of GA (C, F). Image courtesy Simrat K. Sodhi, MSc, MB BChir (Cantab).
Conclusion
Deep learning–based segmentation can yield excellent results. We report a unique approach, using a single network architecture capable of taking the full 3D volume as input and outputting a 2D segmentation that is comparable to expert labeling of GA area. The algorithm has higher R2 and DSC values when cases have large, well-demarcated areas of atrophy and reduces when the number of small islands of atrophy increase. We have been able to show that it is possible to achieve excellent GA segmentation without the need for multiple networks or the addition of nIR image data. Inputting 3D data without prior segmentation is quicker, less error-prone and offers a tractable solution. Our approach highlights that it is possible to accurately segment hypertransmission defects in OCT data without pre-processing.
The area of GA has been used as a primary endpoint in pivotal trials. It is imperative, therefore, that it can be used clinically in the management of patients to monitor the efficacy of their treatment. The GEODE study demonstrates that we are very close to that reality using OCT imagery. RP


References
1. Bakri SJ, Bektas M, Sharp D, Luo R, Sarda SP, Khan S. Geographic atrophy: mechanism of disease, pathophysiology, and role of the complement system. J Manag Care Spec Pharm. 2023;29(5-a Suppl):10.18553/jmcp.2023.29.5-a.s2. doi:10.18553/jmcp.2023.29.5-a.s2
2. Riedl S, Schmidt-Erfurth U, Rivail A, et al. Sequence of morphological changes preceding atrophy in intermediate AMD using deep learning. Invest Ophthalmol Vis Sci. 2024;65(8):30. doi:10.1167/iovs.65.8.30
3. Mai J, Lachinov D, Riedl S, et al. Clinical validation for automated geographic atrophy monitoring on OCT under complement inhibitory treatment. Sci Rep. 2023;13(1):7028. doi:10.1038/s41598-023-34139-2
4. Sadda SR, Guymer R, Holz FG, et al. Consensus definition for atrophy associated with age-related macular degeneration on OCT: classification of atrophy report 3. Ophthalmology. 2018;125(4):537-548. doi:10.1016/j.ophtha.2017.09.028
5. Orr S, Oakley J, Russakoff D, Golding J, Choudhry N. Utilization of en face OCT and deep learning–based automated segmentation to quantify area of GA (ECLIPSE). Invest Ophthalmol Vis Sci. 2023;64(8):307.