Functional assessment of the retina is critical to both clinical ophthalmology and vision research. Several techniques exist for measuring retinal function, such as visual-acuity and contrast-sensitivity tests, psychophysics, and electroretinograms (ERG). However, these approaches have important limitations, such as poor spatial resolution as well as the slightly invasive nature and longer duration of tests. There is great excitement about emerging noninvasive approaches to measuring retinal function, both from clinical and basic scientific perspectives.
As human gene therapy emerges, there is hope for new methods of rescuing dysfunctional photoreceptors, or even restoring vision by transplanting functional photoreceptors.1 A critical aspect of these therapy approaches is assessing the degree of success, and functional imaging at the cellular level would be a great way to do this.2
Vision begins when photons are absorbed in the photoreceptor outer segment (OS), initiating the biochemical process of phototransduction. Also, the photoreceptor OS deforms physically in response to visible stimuli. The first demonstration of light-evoked swelling in photoreceptors was done in 1973 using X-ray diffraction to show that light stimuli increases the average spacing between discs.3,4 The first demonstration of photoreceptor OS elongation in the living human eye was done by Jonna et al in 2007,5 where they showed that coherent flood illumination caused interference in the OS, which could be used to measure its light-evoked elongation. Later, they showed that phase-sensitive optical coherence tomography (OCT) could be used to measure a very slow elongation of the OS,6 but OCT was not yet sufficiently fast to measure faster light-evoked elongation. By using a full-field swept-source (SS) OCT with an effective A-scan rate of tens of MHz and digital aberration correction, Huttman et al showed light-evoked elongation of peripheral photoreceptors.7 In 2019, our group demonstrated that adaptive optics (AO) based OCT may be used to detect and measure functional responses of foveal cone photoreceptors.8 Soon after, Miller et al demonstrated a similar scanning type AO-OCT for functional imaging of cone photoreceptors, specifically for cone-type classification.9 At present, the fastest swept-source used in OCT systems have wavelengths above 1 µm, which provides insufficient lateral resolution for resolving rods. Therefore, recently our group employed a combination of AO, OCT, and scanning light ophthalmoscopy (SLO) to detect light-evoked elongation of both rod and cone photoreceptors.10 The SLO has superior lateral resolution, because it has a shorter wavelength and sub-Airy disk pinhole. This was used to confirm the location and type of photoreceptors in the OCT volume.
SPATIOTEMPORALLY SYNCHRONIZED AO-SLO-OCT
For more than a decade, 2 types of raster-scanned retinal imaging systems equipped with adaptive optics (AO) have been used to study the structure and function of the living human retina. The first of these is AO-SLO,11 in which light scattered by the retina is measured using a detector while using a pinhole conjugated to the retina in order to reject out-of-focus and multiply scattered light. This modality produces a 2-dimensional, areal image of the retina with cellular resolution. It has been used to image the cone mosaic11 and rod mosaic.12 The second raster-scanned AO imaging modality is OCT, which permits volumetric imaging of the retina, including 3-dimensional images of single cells when combined with AO.13
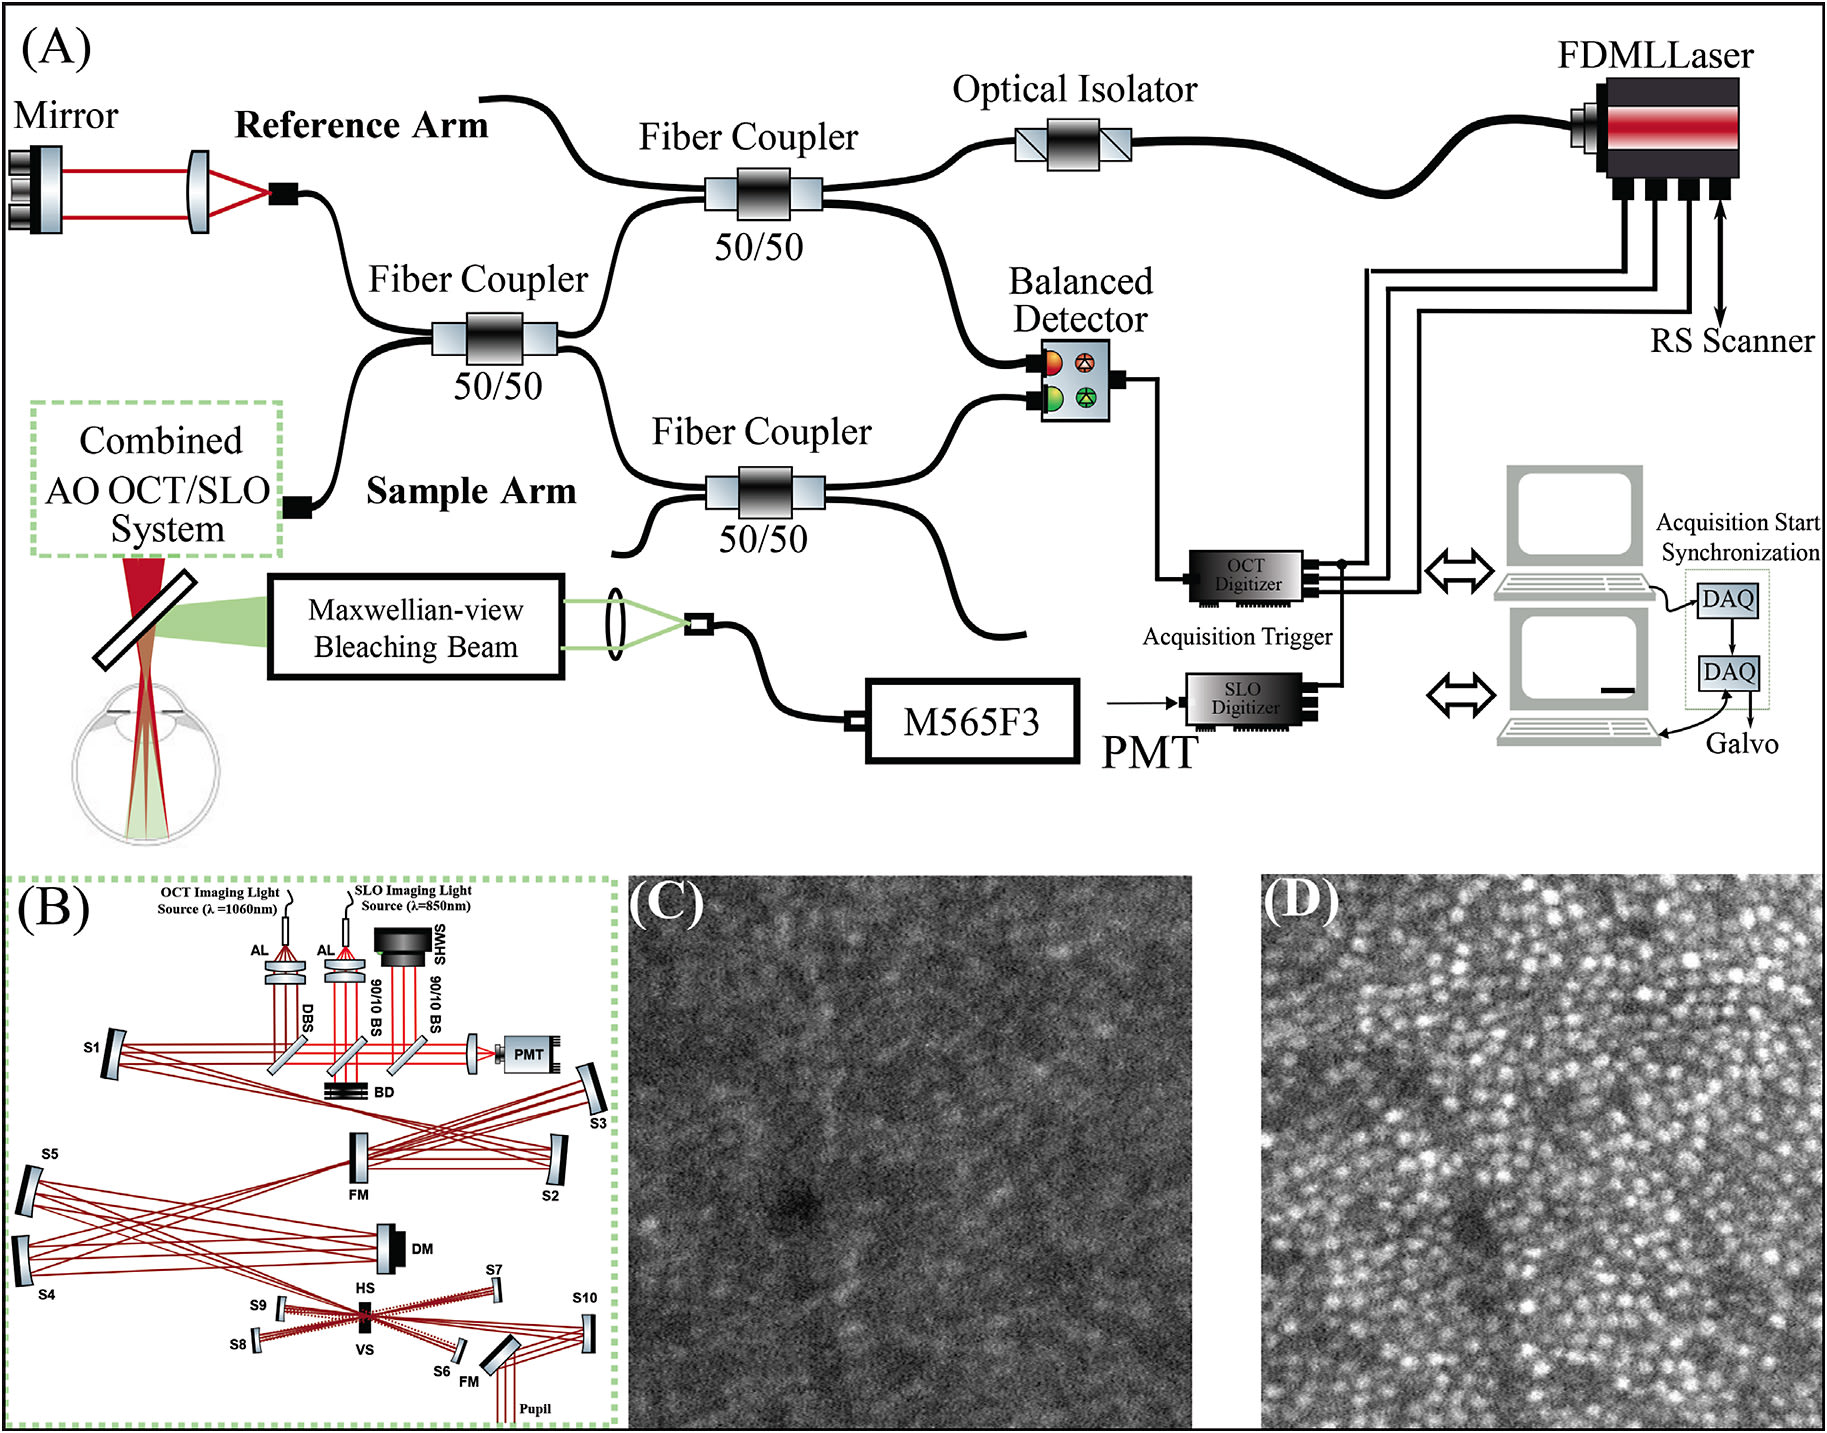
A schematic of the AO-SLO-OCT system is shown in Figure 1A.14 The AO-SLO-OCT system consists of SLO, OCT, and AO subsystems. The SS-OCT system employed a Fourier domain mode locking laser operating at an A-scan rate of 1.64 MHz.15 A Michelson interferometer with 3 50:50 fiber couplers were used to balance the spectra of 2 detection channels. The sample arm of the system consisted of pairs of spherical mirror telescopes in an out-of-plane configuration (Figure 1B). The scanning system contained a resonant scanner oscillating at 2 kHz in the horizontal direction and a galvanometer scanner in the slower vertical direction.

Scanning light ophthalmoscopy illumination was generated with a superluminescent diode (SLD) (𝜆𝑐=840 nm; Δ𝜆=10 nm). Optical power measured at the cornea was 1.8 mW (OCT) and 150 µW (SLO), together below the maximum permissible exposure specified by the latest laser safety standard.16 The lateral resolution of the SLO was used to confirm the location and type of photoreceptors in the OCT volume.
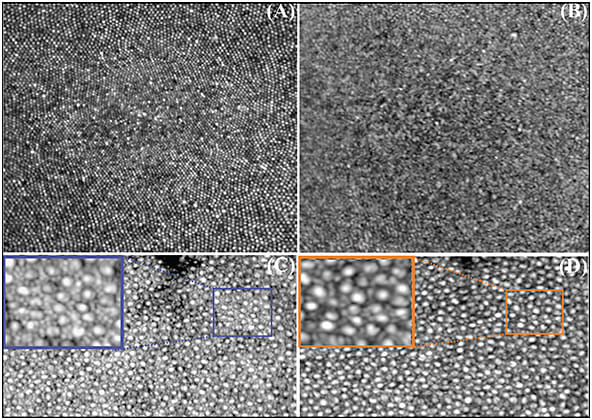
The AO subsystem operates in a closed loop at a rate of 10 Hz using a sub-band of the SLD illumination for wavefront sensing. By measuring and correcting aberrations over a 6.75 mm pupil, it provided a theoretical diffraction-limited lateral resolution of 2.5 µm for the SLO imaging channel and 3.2 µm for the OCT imaging channel. Figures 1C and 1D show the acquired SLO image at 2° temporal retina while the AO loop was turned off and on. The impact of AO on the contrast and lateral resolution of the SLO frame is apparent. Also, examples of high-resolution retinal images acquired using the combined AO-SLO-OCT system in humans is shown in Figure 2. Images A and B show an average of 50 motion-corrected cone mosaics at the fovea from the SLO and OCT channels, respectively. The foveal cones are clearly visible in the AO-SLO image, but they are not completely visible in the AO-OCT image. A motion-corrected average of 50 SLO frames and OCT en-face projections at 6° temporal retina are also shown. A small region in both averaged images was magnified for better visualization of rod and cone photoreceptors.

ALL-OPTICAL FUNCTIONAL RETINAL IMAGING IN HUMANS
After obtaining informed consent, 2 normal subjects, free of known retinal disease, were imaged. Each subject’s eye was dilated and cyclopleged with drops of 2.5% phenylephrine and 1% tropicamide. All procedures were approved by an Institutional Review Board. Subjects were dark-adapted for 30 minutes, and then they were imaged for 10 seconds to 15 seconds. Imaging involved a 10 ms flash of 555 nm light delivered at 2 s with power between 150 nW and 100 µW, which bleached between 0.007% and 4.0% of rod photopigment, or 0.03% and 15% of cone photopigment.17 Acquired SLO frames were registered, and the resulting trace of eye movements was used to register the simultaneously acquired OCT volumes.18 Cones and rods were automatically identified in the registered images and axially segmented in the OCT volumes, providing 3-dimensional tracking of photoreceptors over time. Time-series of the complex axial signal (M-scans) of each photoreceptor were recorded, and the phase differences between inner segment/outer junction (IS/OS) and cone OS tips (COST) as well as between IS/OS and rod OS tips were measured as functions of time.
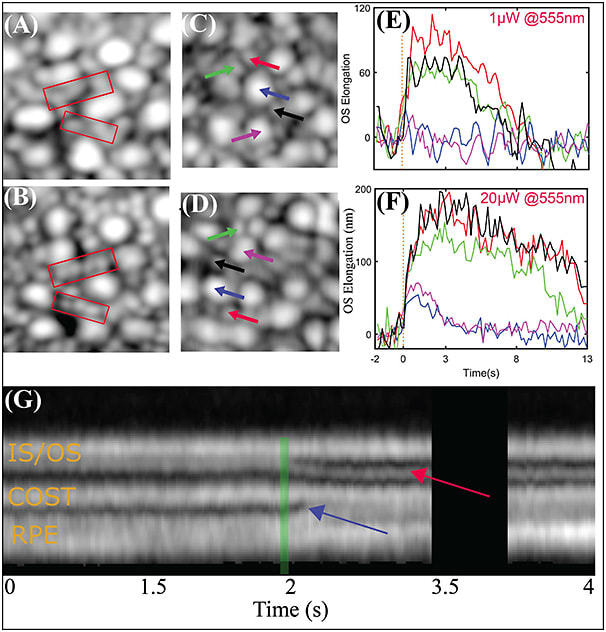
Figures 3A and 3B are examples of simultaneously acquired AO-SLO-OCT images at 6° temporal to the fovea. Rods are not as well resolved in the OCT en face projection, as shown in Figure 3A, as they are in the SLO image, as shown in Figure 3B. Volumetric OCT images clearly revealed cones, as shown in Figures 3C and 3D (purple and blue arrows). These were surrounded by rods (black, green, and red arrows), which were not as well resolved in the OCT. After the stimulus flash was delivered to the retina, elongation was observable in individual rods and cones. The rods were observed to respond to smaller doses of light than cones. Single rods show an elongation between 70 nm and 100 nm to a flash that bleaches 0.05% of rod photopigment, as shown in Figure 3E. The same flash bleaches 0.2% of cone photopigment, but no elongation was observed. When the flash intensity was increased to bleach 1% of rod photopigment and 4% of cone photopigment, elongation was observed in cones, and substantially more was observed in rods, as shown in Figure 3F. Although it would be premature to compare these optoretinographic findings and corresponding electroretinographic measurements, it is noteworthy that the larger, slower response of rods is consistent with their established higher sensitivity and lower temporal bandwidth than their cone counterparts.

In addition to OS elongation, after the stimulus flash, changes in axial morphology were often observed. Representative M scans of single cones for 70% photopigment bleaching is shown in Figure 3G. A common observation was the appearance and/or movement of an extra band between IS/OS and COST, indicated by the red arrow. The reflectivity of this band and its maximal axial distance from IS/OS appear to be proportional to the bleaching light intensity. Another common observation was a change in the appearance of the space distal to COST, including the subretinal space and retinal pigment epithelium, shown with the blue arrow. The retinal pigment epithelium band appears to split, with its apical portion moving inward, toward COST. One hypothesis is that the observed movement could be an indication of melanosome movement into the apical part of the RPE cell.
CONCLUSION
Our group showed that AO-OCT may be used to detect and measure functional responses of rod and cone photoreceptors in the living human eye. In addition, our images reveal stimulus-evoked changes in the intensity and organization of the outer retinal bands. This suggests that the AO-OCT optoretinogram may represent a uniquely sensitive measure of disease-related dysfunction and effectiveness of experimental therapeutic interventions. The ability to measure these responses in rods and foveal cones could have a significant translational impact, due respectively to their putative earlier susceptibility to disease and critical role in normal vision. Despite all the advantages, there are several challenges in commercialization and deployment of AO-OCT systems for clinical applications. These limitations include optical complexity, high cost, and the burden of data volume and processing.19 In the future, by expanding the clinical application of AO-OCT systems, the cost and complexity of the system might be justified. RP
REFERENCES
- Jayakody SA, Gonzalez-Cordero A, Ali RR, Pearson RA. Cellular strategies for retinal repair by photoreceptor replacement. Prog Retin Eye Res. 2015;46:31-66. doi:10.1016/j.preteyeres.2015.01.003
- Aboualizadeh E, Phillips MJ, McGregor JE, et al. Imaging transplanted photoreceptors in living nonhuman primates with single-cell resolution. Stem Cell Reports. 2020;15(2):482-497. doi:10.1016/j.stemcr.2020.06.019
- Corless JM. Lamellar structure of bleached and unbleached rod photoreceptor membranes. Nature. 1972;237(5352):229-231. doi:10.1038/237229a0
- Chabre M, Cavaggioni A. Light induced changes of ionic flux in the retinal rod. Nat New Biol. 1973;244(134):118-120.
- Jonnal RS, Rha J, Zhang Y, Cense B, Gao W, Miller DT. In vivo functional imaging of human cone photoreceptors. Opt Express. 2007;15(24):16141-16160.
- Jonnal RS, Kocaoglu OP, Wang Q, Lee S, Miller DT. Phase-sensitive imaging of the outer retina using optical coherence tomography and adaptive optics. Biomed Opt Express. 2012;3(1):104-124.
- Hillmann D, Spahr H, Pfäffle C, Sudkamp H, Franke G, Hüttmann G. In vivo optical imaging of physiological responses to photostimulation in human photoreceptors. Proc Natl Acad Sci USA. 2016;113(46):13138-13143. doi:10.1073/pnas.1606428113
- Azimipour M, Migacz JV, Zawadzki RJ, Werner JS, Jonnal R. Functional retinal imaging using adaptive optics swept-source oct at1.6MHz. Optica. 2019;6:300-303.
- Zhang F, Kurokawa K, Lassoued A, Crowell JA, Miller DT. Cone photoreceptor classification in the living human eye from photostimulation-induced phase dynamics. Proc Natl Acad Sci USA. 2019;116(16):7951-7956. doi:10.1073/pnas.1816360116
- Azimipour M, Valente D, Vienola KV, Werner JS, Zawadzki RJ, Jonnal RS. Optoretinogram: optical measurement of human cone and rod photoreceptor responses to light. Opt Lett. 2020;45(17):4658-4661. doi:10.1364/OL.398868
- Roorda A, Romero-Borja F, Donnelly Iii W, Queener H, Hebert T, Campbell M. Adaptive optics scanning laser ophthalmoscopy. Opt Express. 2002;10(9):405-412. doi:10.1364/OE.10.000405
- Dubra A, Sulai Y, Norris JL, Cooper RF, Dubis AM, Williams DR, Carroll J. Noninvasive imaging of the human rod photoreceptor mosaic using a confocal adaptive optics scanning ophthalmoscope. Biomed Opt Express. 2011;2(7):1864-1876. doi:10.1364/BOE.2.001864
- Zawadzki RJ, Jones SM, Olivier SS, Zhao M, Bower BA, Izatt JA, Choi S, Laut S, Werner JS. Adaptive-optics optical coherence tomography for high-resolution and high-speed 3D retinal in vivo imaging. Opt Express. 2005;13(21):8532-8546. doi:10.1364/opex.13.008532
- Azimipour M, Jonnal RS, Werner JS, Zawadzki RJ. Coextensive synchronized SLO-OCT with adaptive optics for human retinal imaging. Opt Lett. 2019;44(17):4219-4222. doi:10.1364/OL.44.004219
- Huber R,Wojtkowski M, Fujimoto JG. Fourier domain mode locking (FDML): a new laser operating regime and applications for optical coherence tomography. Opt. Express. 2006;14(8):3225-3237. doi:10.1364/oe.14.003225
- American National Standards Institute. American national standard for the safe use of lasers, vol. 7136. Orlando, FL: Laser Institute of America; 2014.
- Rushton WA, Henry GH. Bleaching and regeneration of cone pigments in man. Vision Res. 1968;8(6):617-631. doi:10.1016/0042-6989(68)90040-0
- Azimipour M, Zawadzki RJ, Gorczynska I, Migacz J, Werner JS, Jonnal RS. Intraframe motion correction for raster-scanned adaptive optics images using strip-based cross-correlation lag biases. PLoS ONE. 2018;13(10):e0206052. doi:10.1371/journal.pone.0206052
- Jonnal RS, Kocaoglu OP, Zawadzki RJ, Liu Z, Miller DT, Werner JS. A review of adaptive optics optical coherence tomography: technical advances, scientific applications, and the future. Invest Ophthalmol Vis Sci. 2016;57(9):OCT51-OCT68. doi:10.1167/iovs.16-19103


