Optical coherence tomography (OCT) is a noninvasive, noncontact diagnostic technique that uses low-coherence interferometry to generates in vivo cross-sectional scans of the retina.1,2 The principle of OCT is based on measuring the time-delay of the light reflected from each optical interface (A-scan) when a pencil of light enters the eye. An OCT cross section (B-scan) is built from many A-scans.
Since the advent of OCT in 1991, the technology has evolved significantly. The first-generation time-domain OCT instrument used an 810-nm diode light source with a moving reference mirror. The scan rate and image resolution were relatively low (~400 A-scans/second; axial resolution 10 μm).3 Current generation spectral domain (SD) OCT (also called Fourier-domain OCT) use an 840-nm diode light source and a fixed mirror. The resulting higher scan rate (20,000-40,000 A-scans/second) and improved axial resolution (3 μm to 5 μm) makes it possible to rapidly scan the entire macula and create a 3-dimensional (3D) reconstruction of the macula.4
Swept-source (SS) OCT, the latest generation in OCT technology, uses a higher wavelength (1050-nm) light source. There is less light scattering by the retinal pigment epithelium (RPE) and media opacity (cataract, etc.), resulting in improved visualization of structures deep to the RPE. The scan rate is even higher (100,000 A-scans/second), resulting in further improvement in image resolution (up to 1 μm axial). Wider field images can be obtained (12-mm scans vs 6-mm to 9-mm scans).5 Various options are available to analyze the data collected using SD-OCT or SS-OCT to create 3D reconstruction of the retina:
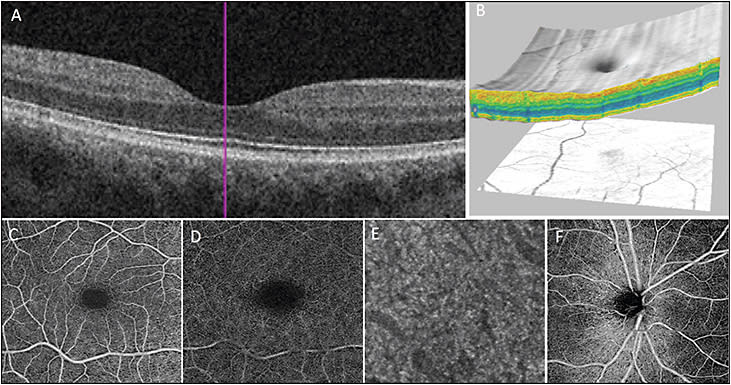
- B-scan: A cross-sectional image of the retina can be obtained in high resolution to evaluate various layers of the retina (Figure 1A).
- 3D imaging: Serial horizontal or vertical B-scans image the entire macula and 3D reconstruction or “cube” image of the macula is obtained. The 3D image can be used to study macula pathologies from various angles and vantage points (sagittal, coronal, and horizontal sections).6,7 Figure 1B shows the macular surface map generated using 3D reconstruction of the macula (Figure 1B).
- C-scan: “En face” imaging allows visualization of various retinal layers.
- Enhanced-depth imaging (EDI): Improved visualization of choroid and suprachoroidal space is obtained by changing the depth of focus of the OCT instrument.8
- OCT angiography (OCTA): New software modification to SD-OCT or SS-OCT instrument that uses motion contract to detect vascular flow non-invasively in vivo (Figure 1C-F). A 3D image of retinal and choroidal vascular flow is generated.
We recently reviewed the advantages of 3D OCT imaging to evaluate retinal conditions in terms of evaluating the retinal morphology.9 This article will incorporate the new 3D vascular flow imaging possible using OCTA and discuss the clinical applications of this new technology along with traditional OCT for diagnosis and management of common retinal disorders.
OPTICAL COHERENCE TOMOGRAPHY ANGIOGRAPHY
OCTA is noninvasive 3D retinal and choroidal vascular flow imaging using motion contrast. OCT data are collected in rapid repeated sequence by scanning the same region of the retina; only data that have changed are analyzed since they represent movement. This motion contrast imaging detects flow through retinal and choroidal blood vessels.
The data can then be visualized in 3D or en face in 2 dimensions (ie, C-scan, Figures 1 C-F, 2).10-20 Any SD-OCT or SS-OCT instrument can be used to generate OCTA if installed with the appropriate software. The software for OCTA has become available for commercial OCT instruments. Various software and technologies have been used to generate OCTA images. They include phase variance OCT, power-doppler OCT, split spectrum amplitude decorrelation (SSADA), optical microangiography (OMAG), and speckle variance and correlation mapping.10-20
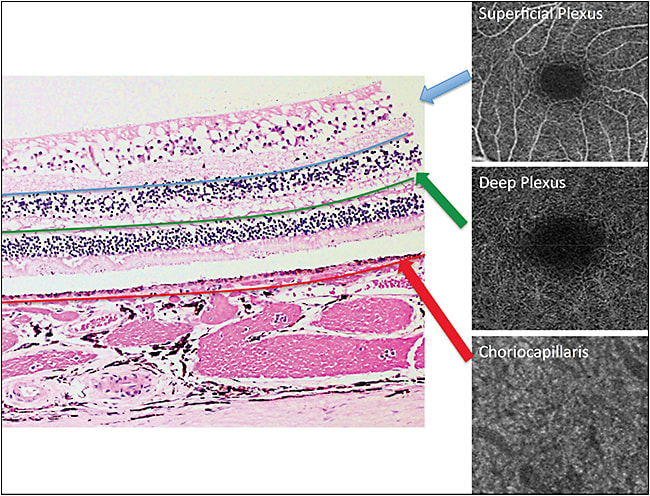
The en-face acquisition areas for OCTA range from 2 mm × 2 mm to 12 mm × 12 mm. Wider scan field decreases the image quality since a fixed number of B-scans is used to scan the area. Most commercially available OCTA scanners use 3 mm x 3 mm or 6 mm x 6 mm scan size and the 12 mm × 12 mm scanners are only available on research prototypes.
Optical coherence tomography angiography images obtained using a smaller 3 mm x 3 mm area have higher image resolution compared to fluorescein angiography (FA) and indocyanine green angiography (ICG). However, OCTA does not visualize vascular leakage seen on FA or ICG.13,14
The main advantage of OCTA over FA or ICG is the 3D information. The exact depth of the abnormality within the retinal or choroidal vasculature can be determined. Scan options for OCTA are similar for the two commercially available OCTA systems (AngioPlex by Zeiss and AngioVue by Optovue). The scan sizes are 3 mm x 3 mm, 6 mm x 6 mm, and 8 mm x 8 mm for both systems. The segmentation options are almost unlimited. Each instrument features preset segmentation options for superficial and deep retinal vascular plexus, outer retina, subretinal, sub-RPE, and choriocapillaris, but these are adjustable (Figures 1C-F and 2).
The superficial retinal plexus contains vessels between the internal limiting membrane (ILM) and posterior border of inner plexiform layer (IPL), which constitutes vasculature of the retinal nerve fiber layer (RNFL) and ganglion cell layer (GCL). The deep retinal plexus contains vessels between posterior border of IPL and posterior border of outer plexiform layer (OPL).15
CLINICAL APPLICATION
The various imaging options available using 3D OCT imaging of the macula provide morphologic and vascular flow information that is important for clinical diagnosis and management of common vitreoretinal conditions.
Diabetic Retinopathy
Diabetic retinopathy is one of the leading causes of blindness in the United States.21 Although the diagnosis can be made on clinical examination, FA and OCT are important tools for evaluating disease severity and assessing the need for treatment in patients with retinopathy. Various retinal vascular changes associated with DR, including microaneurysms, venous beading, intraretinal microvascular abnormalities (IRMA), capillary nonperfusion or ischemia, retinal neovascularization, and leakage, can be detected on FA. Standard SD-OCT is used routinely to evaluate for macular edema, subretinal fluid, intraretinal exudates, and photoreceptor integrity. OCT 3D reconstruction can demonstrate subtle tractional changes in the inner retina that may not be visible on clinical examination.9 Detecting these tractional changes is important for clinical management of DME that may be resistant to medical treatment.22 Moreover, 3D OCT can provide information on visual prognosis because macular thickness and volume can predict progression of diabetes without retinopathy to clinically significant macular edema. Macular volume measured using 3D OCT correlates better with VA than central macular thickness.23-25
Optical coherence tomography angiography is the newest tool in our armamentarium for evaluating the severity of DR. It can visualize some of the retinal microaneurysms associated with DR noted on FA but not all.13 Nonetheless, the 3D imaging provided using OCTA allows the microvascular changes to be localized to specific retinal vascular layers.26 OCTA does not detect vascular leakage, but retinal neovascularization can be detected as abnormal vascular flow in the retinal surface.
Optical coherence tomography angiography can be superior to FA in assessing the perfusion status of the macula and evaluating vision loss that may be associated with DR (Figure 3). In DR, there is a progressive decline in retinal perfusion that is manifested as loss of capillary perfusion at the edges of the foveal avascular zone (FAZ) resulting in enlarged FAZ.17,27 OCTA can detect macular ischemia resulting from enlargement of the FAZ in the deep retinal capillary plexus, which may not be visualized using FA if the FAZ of the superficial retinal capillary plexus is intact.28
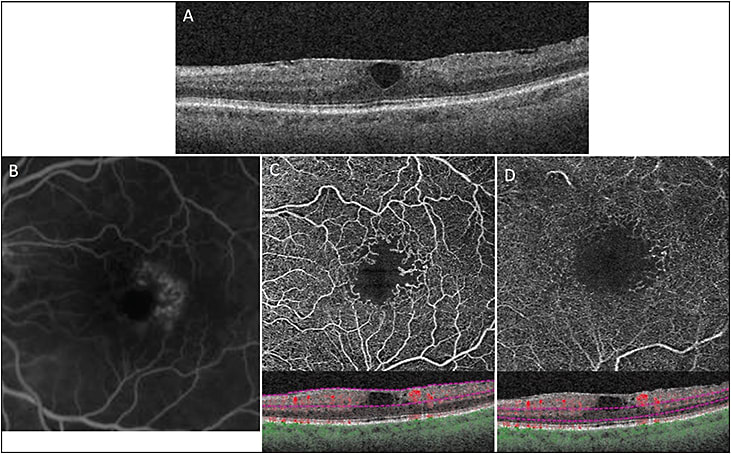
The 3D imaging of choroidal vascular flow using OCTA has shown that DR is a condition that also involves the choroidal circulation. Abnormalities in choroidal vascular integrity have been noted with increasing severity of DR (and associated vision loss) using SS-OCTA.29
Nonexudative AMD
Nonexudative AMD is characterized by presence of drusen, pigmentary changes, and GA in the macula. The 3D macular imaging using OCT has been used to quantify changes in volume of drusen over time.9 Progression of nonexudative AMD can be followed over time by quantitating macular volume, which is a surrogate for macular thinning and atrophy.30-32 In the AREDS2 study, volume of drusen and degree of RPE thinning on SD-OCT were noted to predict 2-year progression of AMD.33
Optical coherence tomography angiography has been used to study choroidal vascular changes associated with nonexudative AMD. A decrease in choriocapillary density, impaired choriocapillaris flow, and inner choroidal ischemia have been shown in eyes with nonexudative AMD.14,34 These areas of impaired choroidal vascular flow extend beyond the borders of GA.
Exudative AMD
Different OCT modalities have been used to localize choroidal neovascular membrane (CNVM) associated with active exudative AMD. Using the C-scan mode and 3D OCT imaging, the highly reflective subretinal and/or sub-RPE material on OCT colocalized with the CNVM seen on FA.35 The intraretinal neovascularization associated with retinal angiomatous proliferation (RAP), a type of exudative AMD, also can be detected using SD-OCT.36
Optical coherence tomography angiography can determine the vascular flow within the CNVM, which can be used for diagnosis as well as management of eyes with exudative AMD. The 3D reconstruction of OCTA has also shown a decline in blood flow within CNVM following treatment with intravitreal anti-VEGF agents.37
Macular Telangiectasia
Macular telangiectasia type 2 (MacTel) is an idiopathic macular condition characterized by perifoveal retinal vascular abnormality and macular degenerative changes. Although the characteristic fundus findings, such as grayish coloration of the juxtafoveal region, deposition of retinal crystals, and presence of right-angled retinal vessels, are used to support the diagnosis, FA and OCT are typically used to make the clinical diagnosis.38 Spectral-domain OCT shows thinning of the macula, cavitation of the inner and outer retina in the juxtafoveal region with eventual loss of photoreceptor inner/outer segment and retinal atrophy.
We have shown using a type of OCTA, power-doppler OCT, that progression of MacTel is associated with abnormal migration and penetration of the retinal perifoveal capillaries to the full thickness of the retina.19 These retinal vascular abnormalities are associated with blurring of the retinal layers seen on B-scan SD-OCT. En face OCTA images of MacTel using 3D imaging show loss of perifoveal retinal capillary flow in both the inner and outer retinal vascular plexuses (Figure 3). The abnormality is more pronounced in the outer plexus. The vessels of the outer retinal plexus show widespread thinning and decreased density in advanced disease.38,39
Vitreoretinal Disease
Three-dimensional OCT provides a topographic view of anatomical changes at the vitreomacular interface. Therefore, it can be used in the diagnosis and treatment planning of pathologies like ERM, vitreomacular traction (VMT), and MH.
In VMT and MH, 3D OCT can show extent and location of the vitreous adhesion to the retina. The information can be helpful in preoperative surgical planning to relieve the traction.40,41 The 3D OCT findings can also have prognostic value. It has been shown that inner macular volume is correlated with visual outcome in patients with surgically closed MH.41
In eyes with ERM, 3D OCT imaging can help assess the level of traction, identify points of attachment of the ERM to the retina, and evaluate for vitreomacular adhesion or traction. It can also be helpful in identifying any free edges of the ERM that may help in starting membrane peeling during surgery.42-44 The macular surface map generated using 3D OCT imaging would illustrate retinal surface changes before and following surgical membrane peeling, changes that can correlate with functional improvement after surgery.41
Macular traction caused by ERM can result in changes in the retinal vasculature (Figure 4). Optical coherence tomography angiography can be used to detect and quantify depth and extent of foveal capillary distortion. Reduction in VA is associated with this distortion.45
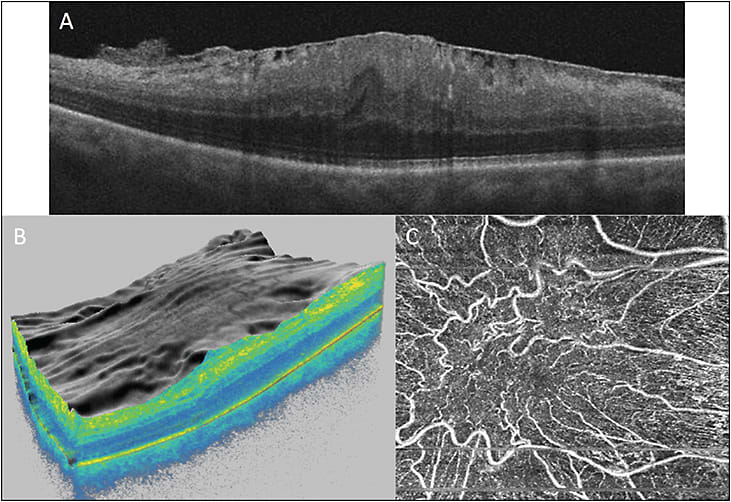
Macular hole is a macular pathology that can be diagnosed on clinical exam or OCT, but associated vascular flow abnormality is a new observation noted on OCTA. Macular choriocapillary flow and perifoveal vascular density are lower in eyes with MH when compared to normal eyes and negatively correlate with size of the hole.46
Other Conditions
The 3D OCT and OCTA imaging have been utilized to evaluate a multitude of vitreoretinal conditions including ocular inflammatory and oncologic conditions.47 Optical coherence tomography can detect changes in integrity of the retinal layers and changes in the RPE or choroid layer that may not be evident on clinical examination. Changes in retinal and choroidal vascular flow can be demonstrated using OCTA.
Because technology for new OCT and OCTA imaging options continues to be developed, the full potential clinical application of the information provided by 3D OCT and OCTA imaging has yet to be realized. RP
REFERENCES
- Huang D, Swanson E, Lin C, et al. Optical coherence tomography. Science. 1991;254(5035):1178-1181.
- Thanos A, Faia LJ, Yonekawa Y, Randhawa S. optical coherence tomographic angiography in acute macular neuroretinopathy. JAMA Ophthalmol. 2016;134(1):1310-1314.
- Forooghian F, Cukras C, Meyerle CB, Chew E, Wong WT. Evaluation of time domain and spectral domain optical coherence tomography in the measurement of diabetic macular edema. Invest Ophthalmol Vis Sci. 2008;49(10):4290-4296.
- Alam S, Zawadzki RJ, Choi S, et al. Clinical application of rapid serial Fourier-domain optical coherence tomography for macular imaging. Ophthalmology. 2006;113(8):1425-1431.
- Michalewska Z, Michalewski J, Nawrocki J. Swept-source OCT. Retina Today. 2013:50-56.
- Ishikawa H, Kim J, Friberg T, et al. Three-dimensional optical coherence tomography (3D-OCT) image enhancement with segmentation-free contour modeling C-Mode. Retina. 2009;50(3):1344-1349.
- Bodnar Z, Akduman L. Three-dimensional OCT for the evaluation of chorioretinal diseases. Ret Phys. 2015;12(4):25-29.
- Spaide R, Koizumi H, Pozzoni M. Enhanced depth imaging spectral-domain optical coherence tomography. Am J Ophthalmol. 2008;146(4):496-500.
- Moisseiev E, Park SS, Yiu G, Werner JS, Zawadzki RJ. The third dimension: advantages of 3D-OCT in retina. Ret Phys. 2016; 13: 24-33.
- Fingler J, Zawadzki RJ, Werner JS, Schwartz D, Fraser SE. Volumetric microvascular imaging of human retina using optical coherence tomography with a novel motion contrast technique. Opt Express. 2009;17(24):22190–22200.
- Makita S, Hong Y, Yamanari M, Yatagai T, Yasuno Y. Optical coherence angiography. Opt Express. 2006;14(17):7821-7840.
- Zhang A, Zhang Q, Chen C, Wang R. Methods and algorithms for optical coherence tomography-based angiography: a review and comparison. J Biomed Opt. 2015;20(10):100901.
- Schwartz DM, Fingler J, Kim DY, et al. Phase-variance optical coherence tomography: a technique for noninvasive angiography. Ophthalmology. 2014;121(1):180-187.
- de Carlo TE, Romano A, Waheed NK, Duker JS. A review of optical coherence tomography angiography (OCTA). Int J Retina Vitreous. 2015;1:5.
- Agemy SA, Scripsema NK, Shah CM, et al. Retinal vascular perfusion density mapping using optical coherence tomography angiography in normals and diabetic retinopathy patients. Retina. 2015;35(11):2353-2363.
- Gerendas B, Waldstein S, Simader C, et al. Three-dimensional automated choroidal volume assessment on standard spectral-domain optical coherence tomography and correlation with the level of diabetic macular edema. Am J Ophthalmol. 2014;158(5):1039-1048.
- Kim DY, Fingler J, Zawadzki R, et al. Noninvasive imaging of the foveal avascular zone with high-speed, phase-variance optical coherence tomography. Invest Ophthalmol Vis Sci. 2012;53(1):85-92.
- Takase N, Nozaki M, Kato A, Ozeki H, Yoshida M, Ogura Y. Enlargement of foveal avascular zone in diabetic eyes evaluated by en face optical coherence tomography angiography. Retina. 2015;35(11):2377-2383.
- Chin EK, Kim DY, Hunter AA III, et al. Staging of macular telangiectasia: power-doppler optical coherence tomography and macular pigment optical density. Invest Ophthalmol Vis Sci. 2013;54(7):4459-4470.
- Jia Y, Tan O, Tokayer J, et al. Split-spectrum amplitudedecorrelation angiography with optical coherence tomography. Opt Express. 2012;20(4):4710-4725.
- Saaddine JB, Honeycutt AA, Narayan KM, Zhang X, Klein R, Boyle JP. Projection of diabetic retinopathy and other major eye diseases among people with diabetes mellitus: United States, 2005-2050. Arch Ophthalmol. 2008;126(12):1740-1747.
- Abe S, Yamamoto T, Kashiwagi Y, Kirii E, Goto S, Yamashita H. Three-dimensional imaging of the inner limiting membrane folding on the vitreomacular interface in diabetic macular edema. Jpn J Ophthalmol. 2013;57(6):553-562.
- Lima-Gómez V, Blanco-Hernández D. Disparity between foveal thickness and macular volume in diabetic macular edema. Cir Cir. 2012;80(1):25-30.
- Sasaki M, Kawashima M, Kawasaki R, et al. Association of serum lipids with macular thickness and volume in type 2 diabetes without diabetic macular edema. Invest Ophthalmol Vis Sci. 2014;55(3):1749-1753.
- Mimouni M, Nahum Y, Levant A, Levant B, Weinberger D. Cystoid macular edema: a correlation between macular volumetric parameters and visual acuity. Can J Ophthalmol. 2014;49(2):183-187.
- Ishibazawa A, Nagaoka T, Takahashi A, et al. Optical coherence tomography angiography in diabetic retinopathy: a prospective pilot study. Am J Ophthalmol. 2015;160(1):35-44.
- Bresnick G, Condit R, Syrjala S, Palta M, Groo A, Korth K. Abnormalities of the foveal avascular zone in diabetic retinopathy. Arch Ophthalmol. 1984;102(9):1286-1293.
- Salz DA, de Carlo TE, Mehreen A, et al. Select features of diabetic retinopathy on swept-source optical coherence tomographic angiography compared with fluorescein angiography and normal eyes. JAMA Ophthalmol. 2016;134(6):644-650.
- Murakami T, Uji A, Suzuma K, et al. In vivo choroidal vascular lesions in diabetes on swept-source optical coherence tomography. Plos One. 2016;11(8):e0160317.
- Ueda-Arakawa N, Ooto S, Ellabban A, et al. Macular choroidal thickness and volume of eyes with reticular pseudodrusen using swept-source optical coherence tomography. Am J Ophthalmol. 2014;157(5):994-1004.
- Iwama D, Hangai M, Ooto S, et al. Automated assessment of drusen using three-dimensional spectral-domain optical coherence tomography. Invest Ophthalmol Vis Sci. 2012;53(3):1576-1583.
- Steinberg J, Göbel A, Fleckenstein M, Holz F, Schmitz-Valckenberg S. Reticular drusen in eyes with high-risk characteristics for progression to late-stage age-related macular degeneration. Br J Ophthalmol. 2015;99(9):1289-1294.
- Folgar FA, Yuan EL, Sevilla MB, et al. Age Related Eye Disease Study 2 Ancillary Spectral-Domain Optical Coherence Tomography Study Group. Drusen volume and retinal pigment epithelium abnormal thinning volume predict 2-year progression of age-related macular degeneration. Ophthalmology. 2016;123(1):39-50.
- Kim DY, Fingler J, Zawadzki RJ, et al. Optical imaging of the chorioretinal vasculature in the living human eye. Proc Natl Acad Sci USA. 2013;110 (35):14354-14359.
- Park SS, Truong SN, Zawadzki RJ, et al. High resolution Fourier-domain optical coherence tomographic imaging of choroidal neovascular membranes. Invest Ophthalmol Vis Sci. 2010;51(8):4200-4206.
- Truong SN, Alam S, Zawadzki RJ, et al. High resolution fourier-domain optical coherence tomography of retinal angiomatous proliferation. Retina. 2007;27(7):915-925.
- Nehemy MB, Brocchi DN, Veloso CE. Optical coherence tomography angiography imaging of quiescent choroidal neovascularization in age-related macular degeneration. Ophthalmic Surg Lasers Imaging Retina. 2015;46(10):1056-1057.
- Zhang Q, Wang R, Chen C, et al. Swept source optical coherence tomography angiography of neovascular macular telangiectasia type 2. Retina. 2015;35(11):2285-2299.
- Spaide RF, Klancnik JM, Cooney MJ. Retinal vascular layers in macular telangiectasia type 2 imaged by optical coherence tomographic angiography. JAMA Ophthalmol. 2015;133(1):66-73.
- Saxena S, Manisha, Meyer CH, Akduman L. Three-dimensional spectral domain optical coherence tomography in vitreomacular traction. BMJ Case Rep. 2014;bcr2013202065.
- Pilli S, Zawadzki R, Werner J, Park SS. Visual outcome correlates with inner macular volume in eyes with surgically closed macular hole. Retina. 2012;32(10):2085-2095.
- Elbendary AM. Three-dimensional characterization of epiretinal membrane using spectral domain optical coherence tomography. Saudi J Ophthalmol. 2010;24(2):37-43.
- Koizumi H, Spaide RF, Fisher YL, Freund KB, Klancnik JM, Yannuzzi LA. Three-dimensional evaluation of vitreomacular traction and epiretinal membrane using spectral-domain optical coherence tomography. Am J Ophthalmol. 2008;145(3):509-517.
- Iwasaki T, Miura M, Matsushima C, Yamanari M, Makita S, Yasuno Y. Three-dimensional optical coherence tomography of proliferative diabetic retinopathy. Br J Ophthalmol. 2008;92(5):713.
- Nelis P, Alten F, Clemens C, Heiduschka P, Eter N. Quantification of changes in foveal capillary architecture caused by idiopathic epiretinal membrane using OCT angiography. Graefes Arch Clin Exp Ophthalmol. 2017;255(7):1319-1324.
- Teng Y, Yu M, Wang Y, Liu X, You Q, Liu W. OCT angiography quantifying choriocapillary circulation in idiopathic macular hole before and after surgery. Graefes Arch Clin Exp Ophthalmol. 2017;255(5):893-902.
- Pichi F, Sarraf D, Arepalli S, et al. The application of optical coherence tomography angiography in uveitis and inflammatory eye diseases. Prog Retin Eye Res. 2017;59:178-201.


