Fundus Autofluorescence in Retinal Disease: A Review and Perspectives
Part one of two parts
MADELINE YUNG, MD • DAVID SARRAF, MD
Due to its noninvasive nature, ease of use, and sensitivity to detect various retinal pathologies, fundus autofluorescence (FAF) imaging has gained a solid foothold in clinical practice, and the scope of its applications continues to grow. This article describes the molecular origins of autofluorescence, compares common FAF imaging systems, and highlights several retinal diseases with characteristic FAF findings (Table 1).
| DISEASE AND GENETIC MUTATION, IF ANY | CLINICAL PRESENTATION | STRUCTURAL ABNORMALITY | ASSOCIATED FAF FINDINGS | ADVANTAGES OF FAF | DIFFERENTIAL DIAGNOSIS |
|---|---|---|---|---|---|
| AMD | early non-neovascular AMD | lipofuscin accumulation, RPE dysfunction and early atrophy | normal, minimal change, focal increase, linear, lace-like, reticular, and speckled patterns described | may show more widespread disease than seen on fundoscopy or color photo. Patchy, linear, and reticular patterns are associated with increased risk for CNV | |
| drusen | small drusen | minimal changes, may be iso-AF | Stargardt disease and other flecked retinal dystrophies | ||
| intermediate drusen — central RPE atrophy surrounded by abnormal RPE | central hypo-AF surrounded by hyper-AF | ||||
| large drusen, drusenoid pigment epithelial detachment | hyper-AF lesions | drusenoid pigment epithelial detachments have high risk for disease progression | |||
| reticular pseudodrusen | accumulations of material above the RPE | round foci of hypo-AF surrounded by hyper-AF in a reticular pattern | best visualized on FAF, NI-FAF, or SD-OCT | ||
| geographic atrophy | RPE atrophy | decreased AF with sharp, demarcated borders. 5 patterns of perilesional hyper-AF: none, focal, banded, patchy, and diffuse [diffuse subtypes: reticular, branching, trickling, fine granular, and fine granular with peripheral punctate spots.] | banded and diffuse patterns with high risk for disease progression | central serious chorioretinopathy | |
| choroidal neovascularization | type 1 (occult): below RPE | hypo-AF due to atrophy of overlying RPE | |||
| type 2 (classic): above RPE | hypo-AF due to blockage by CNV, may have hyper-AF ring | ||||
| type 3: intraretinal | |||||
| hemorrhage/exudates | initial decreased AF due to light absorption, then progresses to hyper-AF | ||||
| RPE tears | RPE and overlying layers are denuded | well-demarcated wedge-shaped or crescenteric hypo-AF with hyper-AF at retracted border. Over time, resurfacing occurs with centripetal recovery of AF | |||
| Central serous chorioretinopathy | serous retinal detachment | initial RPE/choroidal dysfunction with leakage of subretinal fluid | hypo-AF due to blockage by fluid | ultrawidefield FAF can detect cases with peripheral involvement. NI-FAF is more sensitive than SW-FAF | |
| subretinal precipiates from shed photoreceptor debris and macrophages | granular hyper-AF, hyper-AF dots that gravitate inferiorly and collect at lesion borders | ||||
| atrophic gravitational tracts | hypo-AF lesions | ||||
| Stargardt disease: ABCA4 (AR); ELOVL4 (AD) | yellow flecks, foveal atrophy, peripapillary sparing | defective outer segment degradation, lipofuscin accumulation, RPE and photoreceptor degeneration | early disease with general increase in AF, intermediate disease with high variation in mean intensity and texture, late disease with macular hypo-AF from chorioretinal atrophy and hyper-AF flecks | FAF correlates well with visual function and ERG, can be used to monitor disease progression | |
| Best disease: BEST1 (AD) | bilateral yolk-like lesions in macula | previtelliform | iso-AF or minimal hyper-AF | ||
| vitelliform | well-circumscribed, homogenous hyper-AF | ||||
| pseudohypopyon | hyper-AF precipitates gravitating to inferior border of lesion | ||||
| vitelliruptive | hypo-AF lesion with border of hyper-AF condensations | ||||
| atrophic, chorioretinal atrophy | diffuse hypo-AF | ||||
| Acute exudative polymorphous vitelliform maculopathy | exudative retinal detachments with multifocal yellow/white lesions | multifocal subretinal precipitates | foci of subretinal precipitates produce intense hyper-AF | subretinal lesions similar to vitelliform lesions of Best disease, but genetic testing will be negative for BEST1 mutations | |
| Adult onset vitelliform dystrophy: PRPH2 (AD), BEST1 (AD) | bilateral yolk-like lesions in macula | vitelliform lesion | well-circumscribed, homogenous hyper-AF | NI-FAF more sensitive that SW-FAF | Best disease |
| atrophic, chorioretinal atrophy | diffuse hypo-AF | ||||
| Multifocal pattern dystrophy simulating fundus flavimaculatus: PRPH2 (AD) | flecked retinal dystrophy | flecks correspond with increased AF. Classic “dot and halo” lesions with central hypo-AF and halo of hyper-AF | |||
| Retinitis pigmentosa: RHO (AD), USH2A (AR), RPGR and RP2 (X-linked) | ellipsoid degeneration in mid-periphery extending toward the fovea | photoreceptor loss peripherally, ring of outer segment dysgenesis and lipofuscin production, normal retina centrally | hyper-AF “Robson Holder” ring that encroaches centrally with disease progression | FAF correlates well with visual function and can help monitor disease progression, especially in late stages when ERG becomes less reliable | similar rings seen in Leber congenital amaurosis, bull’s eye maculopathy, X-linked retinoschisis, Best disease, cone dystrophy, cone-rod dystrophy |
| Choroideremia: CHM (X-linked recessive) | bilateral mid-peripheral zones of atrophy with central stellate zone of preserved retina | centripetal chorioretinal atrophy | zones of atrophy correlate with hypo-AF | FAF can help identify candidates for gene therapy | |
| female carriers of the CHM mutation also show signs of RPE atrophy, photoreceptor degeneration, and lipofuscin accumulation | peripheral speckled patten of hyper and hypo-AF | FAF can help evaluate female relatives of affected males | |||
| Fundus albipunctatus: RDH5 (AR) | flecked retinal dystrophy, yellow/white subretinal spots in midperiphery | defect in rhodopsin recycling results in decreased generation of photoreceptor pigments and decreased lipofuscin | background decrease in AF, results in grainy images, fleck may manifest as hyper-AF dots | retinitis punctata albescens, RPE65 mutations | |
| Multiple evanescent white dot syndrome | unilateral, multifocal white spots in paramacular and peripheral fundus | lesions result from photoreceptor loss, unmasking the underlying RPE | lesions correlate with hyper-AF spots, smaller dots <100 µm are difficult to appreciate on FAF | FAF has better sensitivity than fundoscopy or fluorescein angiography, though less than indocyanine green angiography | |
| Punctate inner choroidopathy | multifocal choroidal lesions in the absence of uveitis or presumed ocular histoplasmosis | choroidal nodules can break through the RPE, causing RPE atrophy | hypo-AF spots at lesion sites, may have hyper-AF margin due to surrounding photoreceptor loss | ultrawidefield FAF can document extent of peripheral lesions, detect clinically occult hyper-AF lesions indicating active or recurrent disease, and can be used to monitor response to treatment | |
| choroidal neovascularization | focal variation in AF with a surrounding AF ring | ||||
| Hydroxychloroquine toxicity | Caucasians: parafoveal photoreceptor loss with foveal sparing, bull’s eye maculopathy in late stages. Asians: pericentral photoreceptor loss. | photoreceptor degeneration | progressive band of parafoveal or pericentral hyper-AF corresponding to photoreceptor loss | FAF is recommended as part of the multimodal imaging evaluation by the American Academy of Ophthalmology | |
| Didanosine toxicity | well-demarcated, midperipheral, concentric chorioretinal atrophy | chorioretinal atrophy | mottled hyper and hypo-AF in midperiphery that spares the central macula, which progresses to confluent zones of hypo-AF | ||
| Deferoxamine toxicity | various phenotypes: RPE mottling, vitelliform lesions, bull’s eye maculopathy | various | FAF patterns include minimal change, focal, patchy, and speckled | FAF is more sensitive that fundoscopy and can be used to screen patients for toxicity | |
| AMD: AGE-RELATED MACULAR DEGENERATION. CNV: CHOROIDAL NEOVASCULARIZATION. AF: AUTOFLUORESCENCE. RPE: RETINAL PIGMENT EPITHELIUM. NI-FAF: NEAR-INFRARED FAF. SD-OCT: SPECTRAL DOMAIN OPTICAL COHERENCE TOMOGRAPHY. SW-FAF: SHORT-WAVELENGTH FAF. ERG: ELECTRORETINOGRAPHY. | |||||
MOLECULAR ORIGINS OF AUTOFLUORESCENCE
Fluorophores are compounds with the capacity to absorb light at specified wavelengths (excitation spectrum) and then to release light at different wavelengths (emission spectrums). FAF imaging systems illuminate the retina with an excitation beam and then collect the emitted autofluorescence from ocular fluorophores to form a brightness map.1
Ocular Fluorophores
Classically, FAF uses a short-wavelength, blue-light excitation beam (SW-FAF) to construct a topographic map of lipofuscin, the predominant ocular fluorophore with a peak absorption at 470 nm and emission at 600-610 nm.2
Madeline Yung, MD, is ian intern at Olive View-UCLA Medical Cente in Los Angeles, CA. David Sarraf, MD, is on the faculty of the Jules Stein Eye Institute of the Geffen School of Medicine at UCLA. Dr. Sarraf has received research grants from Allergan, Genentech, Optovue, and Regeneron, and he is a consultant to Genentech and Optovue. Dr. Yung reports no financial interests. Dr. Sarraf can be reached via e-mail at dsarraf@g.ucla.edu.
Lipofuscin is a heterogeneous mixture formed from the degradation of photoreceptor outer segments, and it accumulates in retinal pigment epithelium lysosomes with age.1,3 The distribution of lipofuscin reflects the overall health of the RPE and is altered in various retinal diseases. In healthy eyes, the lipofuscin concentration is greatest in the posterior pole, is limited in the fovea, and decreases toward the periphery.1,4
Other ocular fluorophores include vitelliform material and optic disc drusen. Named after their orange yolk-like appearance, vitelliform lesions represent the extracellular deposition of shed outer segment debris in the subretinal space.5-7 Optic disc drusen derive from deposits of extracellular mitochondria in a filamentous protein matrix, and they produce hyperautofluorescence if superficial.8
Other Factors That Influence Autofluorescence
Compounds such as melanin, rhodopsin, and macular pigments can absorb light, prevent the excitation beam from reaching ocular fluorophores, and weaken the autofluorescent signal.3,9,10 Located in RPE cells and uveal melanocytes, melanin absorbs short-wavelength light to protect the retina from light-induced damage.11-13 Notably, melanin does autofluoresce at longer wavelengths, with peak excitation at 787 nm, and it is the primary fluorophore for near-infrared FAF (NI-FAF).14
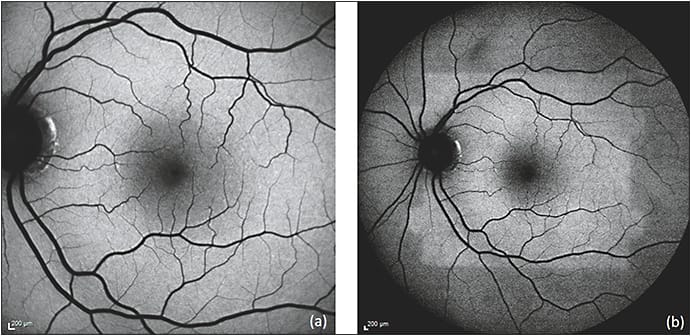
Rhodopsin, a visual pigment found in the rod photoreceptor outer segments, initially attenuates autofluorescence but undergoes photoisomerization with continued light exposure, resulting in the bleaching effect that leads to an increase of background autofluorescence of as much as 30% over time (Figure 1).15,16 The macular pigments lutein, zeaxanthin, and meso-zeaxanthin also filter blue light and protect the retina from photo-oxidative damage.17,18

Figure 1. Bleaching effect due to rhodopsin. Immediately after obtaining a 30 degree FAF (a), the 50 degree FAF (b) shows a discrete area of relative hyper-autofluorescence corresponding to an area of bleached photoreceptors resulting from the first image acquisition.
COURTESY OF BIOMED CENTRAL
Autofluorescence from the cornea and lens can interfere with and degrade image quality. The cornea is excited at 365-480 nm and emits at 620 nm,19 while the lens is excited at 420-430 nm and emits at 520 nm.20 Scattered light from these structures can falsely increase the autofluorescent signal, called pseudoautofluorescence.21
INTERPRETATION OF FAF FINDINGS
Taken together, the cumulative influences of ocular fluorophores, absorptive compounds, and autofluorescent structures anterior to the retina all contribute to form the FAF image.22 FAF abnormalities are classified as hyperautofluorescent (increased signal), hypoautofluorescent (decreased signal), or isoautofluorescent.
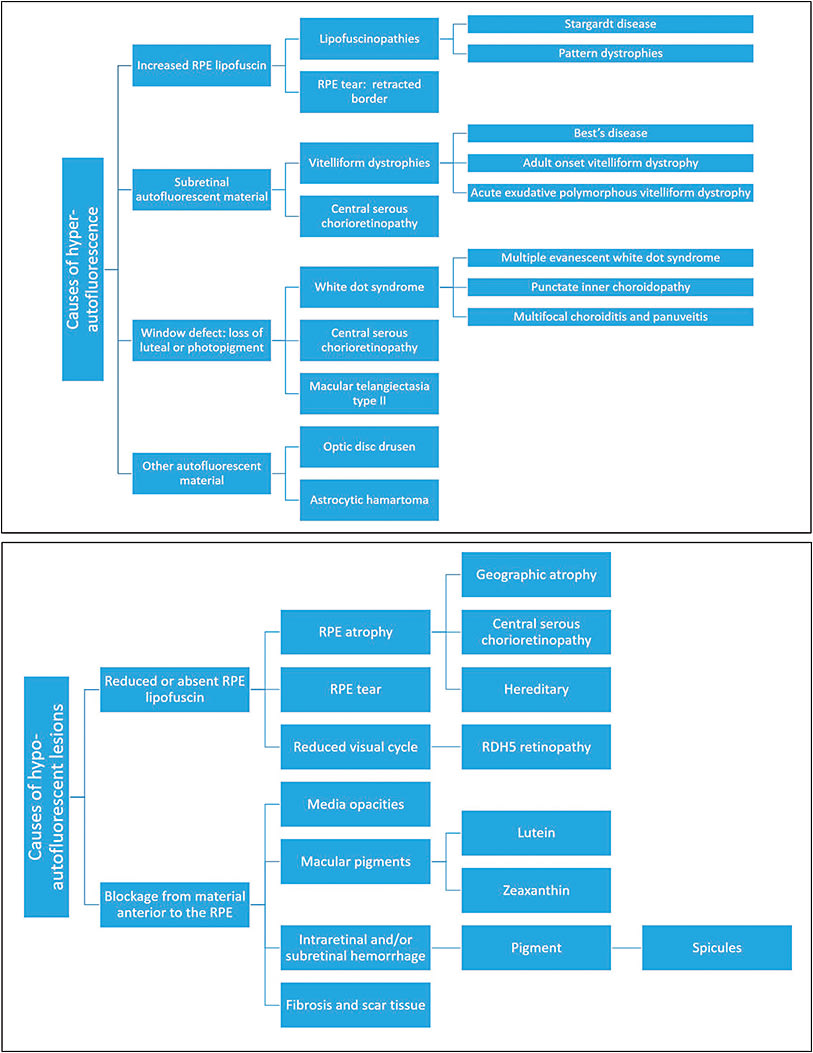
Hyperautofluorescence can result from the accumulation of lipofuscin or other ocular fluorophores due to RPE dysfunction, the bleaching effect, or a window defect from the degeneration of overlying photoreceptors (Figure 2A). Hypoautofluorescence can result from the absence of RPE secondary to atrophy or tearing and blockage or shadowing of the RPE by overlying fluid, structures, or vitreous opacities (Figure 2B). Abnormalities that do not affect the RPE or photoreceptor layers may remain isoautofluorescent.

Figure 2. Causes of hyperautofluorescence (a). Causes of hypo-autofluorescence (b).
COURTESY OF BIOMED CENTRAL
FAF IMAGING SYSTEMS
Fundus Cameras
Fundus cameras, such as those produced by Topcon (Oakland, NJ), Carl Zeiss Meditec (Dublin, CA), and Canon (Melville, NY), utilize single flash (flood light) illumination to produce color autofluorescence images (Figure 3A).23 The single flash of light is more comfortable for patients and renders fundus cameras inherently resistant to motion artifacts, but in turn it yields lower resolution images.

Figure 3. Comparison of common imaging systems available for fundus autofluorescence. Images of normal, healthy retina were obtained using the fundus camera with a Spaide filter (a), confocal cSLO (b), and Optos ultrawidefield systems (c).
COURTESY OF BIOMED CENTRAL
To limit interference from the cornea and lens and reduce absorption from macular pigments, Richard Spaide, MD, introduced the “modified Topcon” filter set, with an excitation filter of 535-583 nm and barrier filter at 615-715 nm,24 which captures red shifted wavelengths. In addition, while SW-FAF and fluorescein angiography share similar excitation spectra and cause cross-interference, the use of red-shifted wavelengths allows for concurrent use of the two techniques.25
Studies have found that fundus cameras provide superior images in patients with exudative retinal disease, perifoveal RPE changes, and cataracts.21,23,26 The limitations of fundus cameras include low contrast, interference by structures anterior to the retina, and the need to install filters after purchase.
Confocal Scanning Laser Ophthalmoscopy (cSLO)
Confocal scanning laser ophthalmoscopes use a series of mirrors to focus a low-power laser in a two-dimensional raster pattern onto the fundus (Figure 3B). Confocal optics then collect autofluorescent emissions from the retinal plane alone, eliminating lens and cornea artifacts.27
Commercially available platforms such as the Heidelberg Spectralis (Franklin, MA) and the Nidek F-10 (Fremont, CA) use an excitation beam of 488 nm and a barrier filter of approximately 500-700 nm.28 Real-time averaging produces high-contrast, high-resolution images, but in turn exposes the system to motion artifacts.23
cSLOs also offer dual-wavelength autofluorescence, a technique used to calculate macular pigment density in the evaluation of retinal diseases.3,29,30 Compared to fundus cameras, cSLOs produce superior images in 70% of cases.23 However, cSLOs are more expensive, cannot be preceded by FA, and have no color options.
Optos Ultrawidefield FAF
The Optos Optomap (Marlborough, MA) ultrawidefield system combines confocal scanning laser technology and an ellipsoid mirror to provide 200º of view (Figure 3C). The system uses two excitation wavelengths of 633 nm (red) and 532 nm (green) and a barrier filter of >540 nm, which allow for concurrent use with FA.16
Ultrawidefield images are essential in documenting retinal conditions with peripheral findings.31 Limitations of the Optos system include distortion of the peripheral retina due to the ellipsoid mirror, lack of image averaging resulting in poor contrast, and lid/eyelash artifacts.32
Additional ultrawidefield options include the Staurenghi lens, which provides 150º of view,33 and the Heidelberg noncontact ultrawidefield system, with a 105º of view.34
CONCLUSION
In the second part of this series, we will continue our discussion of FAF, including the characteristic findings in specific retinal conditions. RP
REFERENCES
1. Delori FC, Dorey CK, Staurenghi G, Arend O, Goger DG, Weiter JJ. In vivo fluorescence of the ocular fundus exhibits retinal pigment epithelium lipofuscin characteristics.Int J Ophthalmol. 1995;36:718-729.
2. Krebs I. Noemi Lois and John V. Forrester: Fundus Autofluorescence. Graefes Arch Clin Exp Ophthalmol. 2011;249:309.
3. Delori FC, Goger DG, Dorey CK. Age-related accumulation and spatial distribution of lipofuscin in RPE of normal subjects. Invest Ophthalmol Vis Sci. 2001;42:1855-1866.
4. Weiter JJ, Delori FC, Wing GL, Fitch KA. Retinal pigment epithelial lipofuscin and melanin and choroidal melanin in human eyes. Invest Ophthalmol Vis Sci. 1986;27:145-152.
5. O’Gorman S, Flaherty WA, Fishman GA, Berson EL. Histopathologic findings in Best’s vitelliform macular dystrophy. Arch Ophthalmol. 1988;106:1261-1268.
6. Arnold JJ, Sarks JP, Killingsworth MC, Kettle EK, Sarks SH. Adult vitelliform macular degeneration: a clinicopathological study. Eye (Lond). 2003;17:717-726.
7. Freund KB, Laud K, Lima LH, Spaide RF, Zweifel S, Yannuzzi LA. Acquired vitelliform lesions: correlation of clinical findings and multiple imaging analyses. Retina. 2011;31:13-25.
8. Tso MO. Pathology and pathogenesis of drusen of the optic nervehead. Ophthalmology. 1981;88:1066-1080.
9. Warrant EJ, Nilsson D-E. Absorption of white light in photoreceptors. Vision Res. 1998;38:195-207.
10. Bone RA, Landrum JT, Cains A. Optical density spectra of the macular pigment in vivo and in vitro. Vision Res. 1992;32:105-110.
11. Feeney L. Lipofuscin and melanin of human retinal pigment epithelium. Fluorescence, enzyme cytochemical, and ultrastructural studies. Invest Ophthalmol Vis Sci. 1978;17:583-600.
12. Feeney-Burns L, Hilderbrand ES, Eldridge S. Aging human RPE: morphometric analysis of macular, equatorial, and peripheral cells. Invest Ophthalmol Vis Sci. 1984;25:195-200.
13. Hu DN, Simon JD, Sarna T. Role of ocular melanin in ophthalmic physiology and pathology. Photochem Photobiol. 2008;84:639-644.
14. Keilhauer CN, Delori FC. Near-infrared autofluorescence imaging of the fundus: visualization of ocular melanin. Invest Ophthalmol Vis Sci. 2006;47:3556-3564.
15. Prieto PM, McLellan JS, Burns SA. Investigating the light absorption in a single pass through the photoreceptor layer by means of the lipofuscin fluorescence. Vision Res. 2005;45:1957-1965.
16. Morgan JI, Pugh EN Jr. Scanning laser ophthalmoscope measurement of local fundus reflectance and autofluorescence changes arising from rhodopsin bleaching and regeneration. Invest Ophthalmol Vis Sci. 2013;54:2048-2059.
17. Weigert G, Kaya S, Pemp B, et al. Effects of lutein supplementation on macular pigment optical density and visual acuity in patients with age-related macular degeneration. Invest Ophthalmol Vis Sci. 2011;52:8174-8178.
18. You QS, Bartsch DG, Espina M, et al. Reproducibility of macular pigment optical density measurement by two-wavelength autofluorescence in a clinical setting. Retina. 2016;36:1381-1387.
19. Van Schaik HJ, Alkemade C, Swart W, Van Best JA. Autofluorescence of the diabetic and healthy human cornea in vivo at different excitation wavelengths. Exp Eye Res. 1999;68:1-8.
20. Sparrow JM, Bron AJ, Brown NA, Neil HA. Autofluorescence of the crystalline lens in early and late onset diabetes. Br J Ophthalmol. 1992;76:25-31.
21. Lois N, Forrester JV. Fundus Autofluorescence. 2nd ed. Philadelphia, PA; Wolters Kluwer Health/Lippincott Williams & Williams; 2016.
22. Yung M, Klufas MA, Sarraf D. Clinical applications of fundus autofluorescence in retinal disease. Int J Retina Vitreous. 2016;2:1-25.
23. Park SP, Siringo FS, Pensec N, et al. Comparison of fundus autofluorescence between fundus camera and confocal scanning laser ophthalmoscope-based systems. Ophthalmic Surg Lasers Imaging Retina. 2013;44:536-543.
24. Spaide RF. Fundus autofluorescence and age-related macular degeneration. Ophthalmology. 2003;110:392-399.
25. Deli A, Moetteli L, Ambresin A, Mantel I. Comparison of fundus autofluorescence images acquired by the confocal scanning laser ophthalmoscope (488 nm excitation) and the modified Topcon fundus camera (580 nm excitation). Int Ophthalmol. 2013;33:635-643.
26. Yamamoto M, Kohno T, Shiraki K. Comparison of fundus autofluorescence of age-related macular degeneration between a fundus camera and a confocal scanning laser ophthalmoscope. Osaka City Med J. 2009;55:19-27.
27. Sharp PF, Manivannan A, Xu H, Forrester JV. The scanning laser ophthalmoscope--a review of its role in bioscience and medicine. Physics Med Biol. 2004;49:1085-1096.
28. Jorzik JJ, Bindewald A, Dithmar S, Holz FG. Digital simultaneous fluorescein and indocyanine green angiography, autofluorescence, and red-free imaging with a solid-state laser-based confocal scanning laser ophthalmoscope. Retina. 2005;25:405-416.
29. Wustemeyer H, Moessner A, Jahn C, Wolf S. Macular pigment density in healthy subjects quantified with a modified confocal scanning laser ophthalmoscope. Graefes Arch Clin Exp Ophthalmol. 2003;241:647-651.
30. Howells O, Eperjesi F, Bartlett H. Measuring macular pigment optical density in vivo: a review of techniques. Graefes Arch Clin Exp Ophthalmol. 2011;249:315-347.
31. Witmer MT, Parlitsis G, Patel S, Kiss S. Comparison of ultra-widefield fluorescein angiography with the Heidelberg Spectralis((R)) noncontact ultra-widefield module versus the Optos((R)) Optomap((R)). Clin Ophthalmol. 2013;7:389-394.
32. Bonnay G, Nguyen F, Meunier I, Ducasse A, Hamel C, Arndt C. [Screening for retinal detachment using wide-field retinal imaging]. J Fr Ophthalmol. 2011;34:482-485.
33. Staurenghi G, Viola F, Mainster MA, Graham RD, Harrington PG. Scanning laser ophthalmoscopy and angiography with a wide-field contact lens system. Arch Ophthalmol. 2005;123:244-252.
34. Espina M, Barteselli G, Ma F, et al. Noncontact ultra-wide field lens system by Heidelberg Spectralis. Invest Ophthalmol Vis Sci. 2014;55:1615-1615.


