OCT Angiography in Retinal Diagnosis and Treatment
A new modality for diagnostic imaging and follow-up
NADIA K. WAHEED, MD, MPH • TALISA E. DE CARLO, BA • ADAM T. CHIN, BA • JAY S. DUKER, MD
Optical coherence tomography angiography (OCTA) is a new imaging modality that generates three-dimensional, depth encoded images of blood flow within the eye by using motion contrast. It is based on rapid OCT scanning of the eye and compares repeat scans acquired at the same position in the retina to look for changes in the scan.1
Because the structures in the retina are static, the only changes in scans from the back of the eye would be caused by blood flowing through vasculature or by movement of the eye itself. After correcting for gross eye motion (by using motion tracking or software processing), the only differences remaining between OCT images of the same point in the eye would represent blood flow.
Mapping these areas of blood flow by point-to-point (or A scan–to–A scan) comparison of two or more OCT volumetric cubes provides incredibly detailed maps of the vasculature of the retina rapidly, in a noninvasive manner, using OCT scanning alone and without the use of any kind of exogenous dye.
While this technology can theoretically be applied to any set of SD-OCT volumetric scans, it is only with the introduction of higher-speed SD-OCT scanning that sufficiently detailed images of the vasculature can be obtained to allow for the generation of meaningful OCT angiograms. Current commercially available SD-OCT devices, scanning at a rate of 70,000 A scans per second or more, are required to generate OCTA images.
The advantages of OCTA over traditional angiography are that it is completely noninvasive, does not involve the risks of exogenous dye injection, takes approximately 3-4 seconds of scanning time per eye, and multiple sets of scans or angiograms can be acquired at the same visit.
Nadia K. Waheed, MD, MPH, is assistant professor of ophthalmology at the Tufts University Medical Center (TUMC) in Boston, MA. Talisa E. de Carlo, BA, and Adam T. Chin, BA, are medical students at TUMC. Jay S. Duker, MD, is professor and chair of ophthalmology at TUMC. None of the authors reports any financial interests in products mentioned in this article. Dr. Waheed can be reached via e-mail at nadiakwaheed@gmail.com.
Moreover, OCTA provides depth resolved information that can be used to isolate vascular structures in the different layers of the retina and visualize them individually, which can be advantageous in a variety of retinal pathologies, such as exudative age-related macular degeneration, diabetic retinopathy, and vascular occlusions, as discussed below.
In addition, the angiography image comes cross-registered with structural OCT B scans (because the angiography image is generated by comparison of corresponding OCT B scans in a volumetric scan). This process allows for precise registration and therefore correlation of the vasculature to the structural scans.
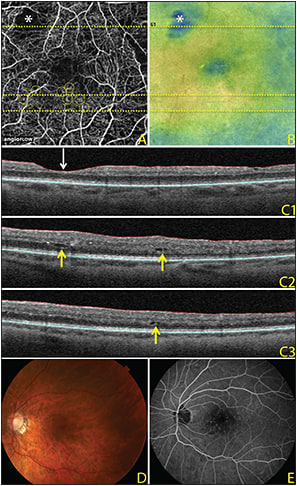
Figure 1 is an OCT angiogram in a diabetic patient with the corresponding structural OCT B scans, as well as the thickness map. Note how the microaneurysm seen on the OCTA image corresponds to intraretinal cysts on the corresponding OCT B scans and to retinal thickening on the thickness map.

Figure 1. OCTA images, 3 mm x 3 mm, of a diabetic eye. The horizontal lines across the OCT angiogram (A) and OCT retinal map (B) represent the locations of the three corresponding OCT B scans (C). The OCT angiogram demonstrates an area of capillary nonperfusion (asterisk) that corresponds to thinning on the OCT retinal map and corresponding OCT B scan (C1; white downward-facing arrow). Microaneurysms (yellow circles) on the OCT angiogram are adjacent to intraretinal cysts, as seen on the corresponding OCT B scans (C2-3; yellow upward-facing arrows) and correspond to thickening on the OCT retinal map. Color fundus photograph (D) and fluorescein angiography (E) of the same eye.
INTERPRETATION OF OCT ANGIOGRAPHY
Optical coherence tomography angiography images can be displayed in various different ways. Because corresponding B scans in volumetric data sets are compared to each other, the decorrelation map can be displayed as a cross-sectional B scan image and can provide very detailed structure for vascular correlation.
However, most commonly, the OCTA image is displayed as an en face map of the vasculature, which offers the advantage of allowing for visualization of the vasculature over the entire region of the scan in one image and also corresponds to what ophthalmologists are used to seeing on retinal exams and on fluorescein angiography.
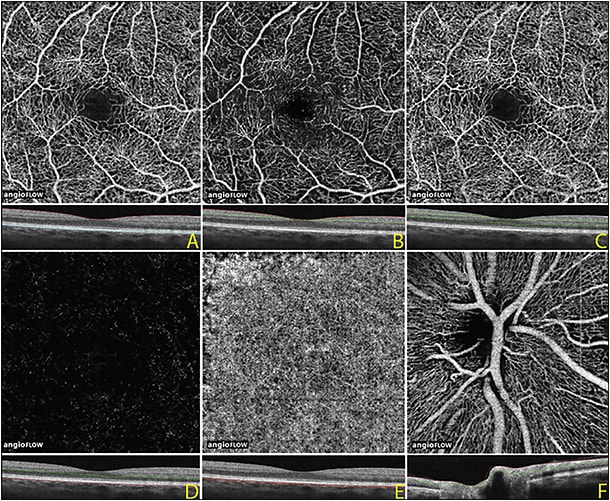
The en face vascular image can include all the vessels seen throughout the retina (Figure 2A, page 44) or can be used to isolate the vessels in the inner retinal layers, the middle retina, and the outer retina.

Figure 2. OCTA image, 3 mm x 3 mm, of a normal eye. Full thickness OCT angiogram and corresponding OCT B scan of the internal limiting membrane to Bruch’s membrane (A). OCTA of the inner retina (B), middle retina (C), outer retina (D), and choriocapillaris (E). OCTA at the optic nerve showing the radial peripapillary vascular network (F).
These approaches are illustrated in Figures 2B to 2D, in which segmentation displays the inner retinal plexus in the superficial retina, the deep retinal plexus in the middle retina, and the outer retina, which is devoid of any retinal vasculature except in pathology, such as choroidal neovascularization. Sometimes, the different retinal vascular layers can be color-coded, allowing for the display of the 3D information in a two-dimensional display format.
Further, in the peripapillary area, superficial segmentation also allows for the visualization of the radial peripapillary network of vessels (Figure 2F).
Deeper segmentation allows for the visualization of the choriocapillaris, although there may be loss of resolution at this level because of reduced penetration of the SD-OCT signal beyond the retinal pigment epithelium (Figure 2E).
Longer wavelength swept source OCT may allow for better penetration past the RPE, therefore allowing for better visualization of the choriocapillaris and of structures beneath the RPE.
OCTA IN CHOROIDAL NEOVASCULARIZATION
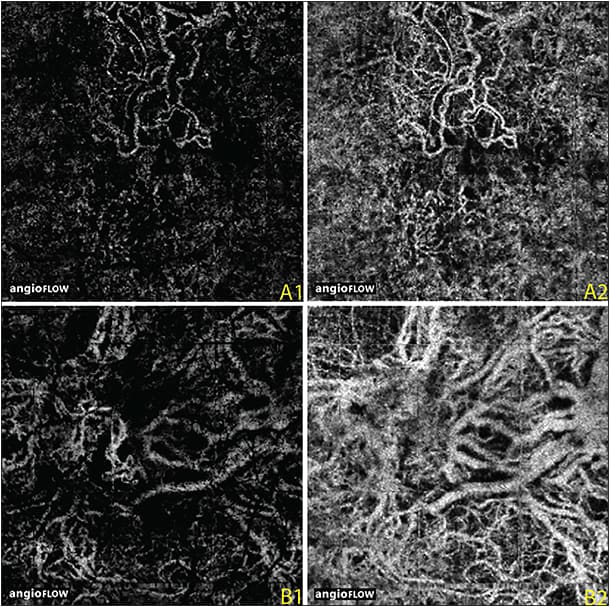
Perhaps one of the most useful clinical applications of OCTA may be the visualization and monitoring of CNV (Figure 3). Jia et al2 initially described the utility of OCTA in the visualization of CNV in wet AMD and its utility in the quantitative evaluation of CNV using OCTA.

Figure 3. OCTA images, 3 mm x 3 mm, of two eyes with neovascular age-related macular degeneration. OCT angiogram of the outer retina in one eye shows lacy choroidal neovascularization (A1); the underlying choriocapillaris shows abnormal vessels below the CNV that appear to feed into the neovascularization. OCTA of the outer retina (B1) in the second eye shows a poorly circumscribed CNV. A larger net is seen below in the underlying choriocapillaris (B2).
Since then, de Carlo et al3 have described the sensitivity and specificity of OCTA in the detection of CNV in wet AMD, and they demonstrated high sensitivity except in patients with large amounts of hemorrhage, in which the presence of blood can impede the penetration of the OCT signal. OCTA can provide useful information about the morphology and size of CNV and its response to therapy.
However, at present, traditional parameters, such as the presence of subretinal and intraretinal fluid, remain the best measures of treatment response in patients with wet AMD.
More interestingly, OCTA may provide us insight into the response of CNV to anti-VEGF treatments. A loss of fine vasculature of the CNV has been noted in patients who receive anti-VEGF therapy.
Recently, Richard Spaide, MD,4 showed the pruning of the small vessels but persistence of the larger vessels of CNV seen in patients who were treated with anti-VEGF agents.
The observed “abnormalization” of the vessels may be explained by periodic pruning of angiogenic vascular sprouts by VEGF withdrawal in the presence of unimpeded arteriogenesis.
Bonini Filho et al5 demonstrated high sensitivity and specificity of OCTA in the detection of CNV in patients with central serous chorioretinopathy, in which the absence of large amounts of subretinal and intraretinal hemorrhage allows for better penetration of the OCT signal into the area with CNV.
OCT ANGIOGRAPHY IN DIABETIC RETINOPATHY
Optical coherence tomography angiography provides useful information on both the structural and vascular changes in diabetics that can be used to monitor patients with diabetic macular edema over time. OCTA allows for exquisite visualization of the retinal vasculature in much greater detail than can be seen on FA, including vascular remodeling, tortuosity, capillary loss, and the formation of microaneurysms.
In addition, because the vascular scan is coregistered with the structural scan, the “multidimensional” nature of the imaging allows for correlation of the vascular changes, such as microaneurysm formation, with the structural changes, such as retinal thickening and cyst formation (Figure 1) in DME.
Because OCTA relies on rapid flow of blood in the vasculature, it cannot visualize leakage. This may be a limitation in certain conditions; however, it also means that the fine vascular structure is not obscured by leaking dye.
As demonstrated above, structural correlates to leakage, such as the presence of edema, are easily visualized in the structural scans that are used to generate the angiographic scans.
Also, OCTA is able to visualize some, but not all, of the areas that appear as microaneurysms on FA, which is believed to be because microaneurysms as seen on FA, are a “mixed bag” of vascular abnormalities that include vascular dilation, vascular looping, and other structural abnormalities. Some microaneurysms may have flow so slow that it is below the detection threshold of current OCTA devices and software.
Optical coherence tomography angiography can also visualize neovascularization in diabetic patients and may provide a way to monitor the presence and extent of retinal neovascularization over time. However, because OCTA only provides a very limited field of view currently, the scans must be centered over the area of neovascularization.
OCTA IN OTHER RETINAL PATHOLOGY
One of the earliest retinal changes described with OCTA by Thorell et al6 was the visualization of the vascular abnormalities seen with macular telangiectasias. This pathology is ideally suited for visualization with OCTA because it has both vascular and correlating structural abnormalities that are well visualized with OCTA.
Vascular occlusions, such as central and branch retinal vein occlusions, as well as central and branch retinal artery occlusions, can be visualized on OCTA. The area of ischemia is well delineated and correlates well with the area seen on FA.
The superficial and deep retinal capillary plexus can be separated, which may allow for better appreciation of the lesions affecting primarily the middle retina, which might not be as well visualized with FA.
LIMITATIONS OF OCTA
Despite providing useful information that can, in most situations, replace and potentially add to the information gleaned from FA, it is important to understand the limitations of OCTA.
First, OCTA is able to visualize only moving erythrocytes; therefore, it is not able to visualize vessels that have no flow or that have flow that is slower than the detection threshold of the OCTA. This is discussed in greater detail in the diabetes section above, explaining the inability of OCTA to visualize some of the microaneurysms seen on FA.
Second, OCTA is currently unable to visualize leakage, which may be both an advantage and a disadvantage, because it means that leakage does not obscure the vascular structures seen by OCTA. The coregistered structural OCT scans provide indirect information about leakage such as the presence of macular edema.
Third, OCTA has a limited field of view. Although the field of view can be expanded, doing so would mean lower scanning density and therefore loss of resolution for a given scan time. Future enhancements, such as the introduction of higher speed swept source OCTA systems, may permit scanning over wider fields of view.
Another strategy is the montaging of multiple images to increase the field of view, as has been demonstrated by Choi et al7 and de Carlo et al.8 In any event, OCTA does not have the ability to replace widefield imaging at present.
Fourth, OCTA is dependent on accurate retinal segmentation to allow for visualization of retinal vessels at the various different levels. However, in situations in which the retinal anatomy is sufficiently disrupted to make accurate segmentation difficult, there may inaccurate localization of the depth of the vessels seen. This error can be easily recognized by clinicians if they scroll through the entire 3D data set, rather than looking at individual en face printouts. Inaccurate segmentation can be corrected by manually adjusting the segmentation lines, but this process is time consuming.
Finally, OCTA images may have artifacts that can make interpretation of the images difficult. Because OCTA is dependent on patient fixation, poor fixation is often associated with multiple movement artifacts that can be exacerbated by postacquisition processing. Additionally, media opacities can cause attenuation of the OCTA signal.
As clinicians grow more familiar with OCTA and integrate it into their routine clinical practice, it will become increasingly important to recognize and account for or to correct these artifacts. Various strategies, such as software to correct for motion and eye tracking technology, are being employed to overcome this hurdle.
CONCLUSION
Optical coherence tomography angiography is a promising new imaging modality that provides 3D depth resolved information on the retinal vasculature using noninvasive imaging techniques. It has shown great promise in the imaging of chorioretinal pathology, both for clinical use and to potentially enhance our understanding of the pathogenesis and evolution of retinal disease.
In the future, further enhancements, such as increased scanning speeds, better software processing, and the introduction of longer wavelength swept source technology, may further enhance the abilities of OCTA. RP
REFERENCES
1. Spaide RF, Klancnik JM, Cooney MJ. Retinal vascular layers imaged by fluorescein angiography and optical coherence tomography angiography. JAMA Ophthalmol. 2014;133:E1-E6.
2. Jia Y, Bailey ST, Wilson DJ, et al. Quantitative optical coherence tomography angiography of choroidal neovascularization in age-related macular degeneration. Ophthalmology. 2014;121:1435-1444.
3. de Carlo TE, Bonini Filho MA, Chin AT, et al. Spectral-domain optical coherence tomography angiography (OCTA) of choroidal neovascularization. Ophthalmology. 2015 Mar 17. [Epub ahead of print]
4. Spaide RF. Optical coherence tomography angiography signs of vascular abnormalization with antiangiogenic therapy for choroidal neovascularization. Am J Ophthalmol. 2014 Apr 14. [Epub ahead of print]
5. Bonini Filho MA, de Carlo TE, Ferrara D, et al. Optical coherence tomography angiography (OCTA) detection of choroidal neovascularization (CNV) in chronic central serous chorioretinopathy (CSCR). JAMA Ophthalmol. In press.
6. Thorell MR, Zhang Q, Huang Y, et al. Swept-source OCT angiography of macular telangiectasia type 2. Ophthalmic Surg Lasers Imaging Retina. 2014;45:369-380.
7. Choi W, Mohler KJ, Potsaid B, et al. Choriocapillaris and choroidal microvasculature imaging with ultrahigh speed OCT angiography. PLoS ONE. 2013;8:e81499.
8. de Carlo TE, Salz DA, Waheed NK, et al. Visualization of the retinal vasculature using wide-field montage optical coherence tomography angiography. Ophthalmic Surg Lasers Imaging Retina. In press.


