Imaging the Evolution of Dry AMD: Part II
In the second of two articles, the authors examine how new modalities are changing how clinicians see this disease.
MARCO A. ZARBIN, MD, PhD • PHILIP J. ROSENFELD, MD, PhD
In the previous article, we outlined the recent advances in retinal imaging and discussed how these new modalities could be used to image retinal microstructures. In this second of two parts, we will explore how to apply these techniques in the specific context of nonexudative age-related macular degeneration.
IMAGING EARLY AMD
Using enhanced depth imaging (EDI)-OCT, Margolis and Spaide1 and Barteselli et al2 reported that age inversely correlates with choroidal volume, primarily due to a loss of small vessel volume. Manjunath et al3 reported similar results using SD-OCT.
Also using EDI-OCT, Ko et al4 reported an inverse correlation between choroidal thickness and drusen load. Similarly, Lee et al5 reported a significant reduction in choroidal thickness once nonexudative AMD severity had progressed to AREDS stage III or IV.6
These results are consistent with the notion that abnormalities in choroidal blood flow are intimately associated with AMD pathogenesis, but they do not clarify whether these choroidal changes are primary or secondary.
Characteristics of Drusen in Early Dry AMD
Although cuticular drusen, subretinal drusenoid deposits, and soft drusen consist of similar components, they are distinguishable by multimodal imaging due to differences in location, morphology, and optical filtering effects by drusenoid material and the RPE.7
Marco A. Zarbin, MD, PhD, FACS, is professor and chair of the Institute of Ophthalmology and Visual Science, Rutgers New Jersey Medical School, Newark. Philip J. Rosenfeld, MD, PhD, is professor of ophthalmology at the Bascom Palmer Eye Institute at the University of Miami Miller School of Medicine in Florida. Dr. Zarbin reports no financial interests in any products mentioned in this article. Dr. Rosenfeld reports financial interest in Acucela. The New Jersey Lions Eye Research Foundation supported this research in part. Dr. Zarbin’s e-mail is zarbin@rutgers.edu.
Soft drusen usually consist of basal linear deposits under the RPE.8,9 They appear yellow-white and range in size from >63 to 1,000 µm in diameter, and RPE on the surface may be attenuated at the apex of the druse. In general, the larger the druse, the more frequently abnormalities of RPE morphology and pigmentation appear.
Cuticular drusen are smaller (50-75 µm in diameter) and tend to appear as clusters of yellow-white, punctate, uniform sub-RPE deposits.9,10 Subretinal drusenoid deposits are polymorphous, light-gray, interconnected accumulations of extracellular material interposed between the apex of the RPE and the photoreceptor outer segments.
Subretinal drusenoid deposits can be extensive, often covering an area much larger than soft drusen.11,12 They also can contain refractile material that simulates the appearance of cuticular drusen.13
Spaide and Curcio7 demonstrated that the critical determinants of lesion appearance include: (1) lesion composition, shape, and size; (2) the location of extracellular material relative to the RPE; and (3) changes in drusen-associated RPE morphology/pigmentation that affect RPE light absorption.
Light Absorption by Drusen
Due to their location external to the RPE, light reflected off of soft and cuticular drusen is subject to a variable amount of blue light attenuation, which underlies the yellow color of the drusen with ophthalmoscopy or fundus photography.7 Soft drusen are thus difficult to visualize in blue light.
In contrast, subretinal drusenoid deposits are not subject to blue light filtering by the RPE and appear more prominent when viewed with blue light because the subjacent RPE absorbs blue light, creating a darker background that facilitates visualization of the drusen.7
As a result, subretinal drusenoid deposits tend to appear whiter than soft drusen. In red light, soft drusen tend to appear bright, whereas subretinal drusenoid deposits are difficult to visualize.7
Differences in the spatial contour of soft and cuticular drusen contribute to their different appearances with fluorescein angiography.7 Cuticular drusen have a triangular cross-sectional shape with significant RPE attenuation at the apex and compacting of RPE at the base.
Decreased fluorophore density in the light path results in less fundus autofluorescence at the apex, and decreased melanin in the light path allows for greater passage of both the excitation and emission wavelengths of light on FA at the apex.7
As a result, less attenuation of blue light typically occurs at the center of a cuticular druse vs a soft druse, as well as greater absorption of blue light at the edge of a cuticular druse vs that of a soft druse.
On FA, the result is that cuticular drusen demonstrate pinpoint hyperfluorescence centrally. In contrast, the apices are hypofluorescent with blue FAF imaging. The fluorescence properties of soft drusen depend on the pigment content of overlying RPE and probably also on the biochemical composition of the drusen material.14,15
As a result, the staining properties of soft drusen on FA range from hyper- to hypofluorescent, particularly in the early phases of the angiogram. On FA, subretinal drusenoid deposits may demonstrate minimal hypofluorescence or may not be evident.
OCT and FAF Imaging of Drusen
On SD-OCT imaging, cuticular drusen tend to have a shape ranging from triangular to prolate.7,16 Because cuticular drusen tend to occur in clusters, they exhibit a sawtooth pattern, in which the basal diameter of each druse is comparable to its height.7,16
Light penetration is greatest through the apex of cuticular drusen (the thickest part of such drusen) due to rarefaction of the RPE at their apices. Conversely, light penetration is least at the base of cuticular drusen (the thinnest part of such drusen) (Figure 1).
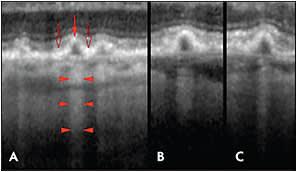
Figure 1. Penetration of light through cuticular drusen revealed by OCT. A) Each druse shows thinning of the overlying RPE at its apex (red arrow) and RPE thickening at its base (open arrows). Penetration of light into the underlying choroid is blocked at sites adjacent to the drusen (bodies of the arrowheads), while transmission of light is increased in the center of each druse (at the points of the arrowhead).
B, C) The transmission of light into the deeper layers thus varies not according to the thickness of the druse material, but by the thickness of the RPE.
CREDIT: WOLTERS KLUWER
As a result, in the case of cuticular drusen, the light absorption property of the drusen is the major determinant of light transmission and not the thickness of the drusen.7
On SD-OCT, soft drusen appear as mounds of sub-RPE material of varying height and with variable degrees of demonstrable continuity with adjacent soft drusen. SD-OCT of subretinal drusenoid deposits demonstrates material in the subretinal space between the outer limiting membrane and the apex of the RPE.7
With autofluorescence imaging, the edges of soft drusen can appear somewhat more fluorescent than the center, particularly when using a fundus camera (vs SLO) imaging system.7 Subretinal drusenoid deposits appear somewhat darker than adjacent uninvolved areas with FAF.7
Near-infrared Imaging
Near-infrared fundus reflectance (NIR) of soft drusen with scanning laser ophthalmoscopy shows subtle changes in gray scale tones, whereas conventional green light monochromatic fundus photos demonstrate higher contrast images of drusen.7 Subretinal drusenoid deposits appear somewhat darker than adjacent uninvolved areas with SLO-NIR.7
Forte et al17 examined patients with dry AMD using combined confocal SLO/SD-OCT to assess NIR, FAF, FA, near infrared autofluorescence (NIA), and SD-OCT simultaneously.
In the absence of central GA, the foveal area always showed normal NIR, reduced FAF, reduced FA fluorescence, and increased NIA. Small to intermediate-sized drusen always showed an increased, well-defined fluorescence on NIR, FAF, NIA, and FA.
On SD-OCT, small to intermediate-sized drusen appeared as focal RPE thickening. Large drusen, which appeared as diffuse elevations of the RPE on SD-OCT, usually showed varying degrees of NIR (increased or reduced), FAF (normal or increased and well-defined), NIA (normal, reduced, or diffusely increased), and increased FA fluorescence.
Subretinal drusenoid deposits appeared bright on NIR and appeared darker than uninvolved surrounding areas on FAF and NIA (Figure 2, page 53).17 The appearance of subretinal drusenoid deposits on FA ranged from invisible to minimal hypofluorescence.17
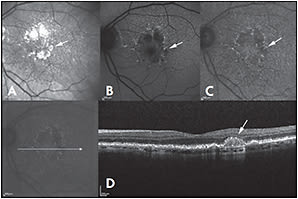
Figure 2. Near-infrared reflectance (NIR) (A), fundus autofluorescence (FAF) (B), and near-infrared autofluorescence (NIA) (C) of a patient with dry AMD. Drusenoid deposit is present at the margin of the retinal pigment epithelium atrophy (arrow) and is bright on NIR, while it appears dark on NIA and FAF. On spectral domain optical coherence tomography (D), drusenoid deposits show a subretinal localization.
CREDIT: WILEY
Some Data From Studies
Querques et al18 described the presence of intense multilaminar sub-RPE hyper-reflectivity in eyes with regressing calcific drusen. The hyper-reflectivity localized above the outer portion of Bruch’s membrane (Figure 3).
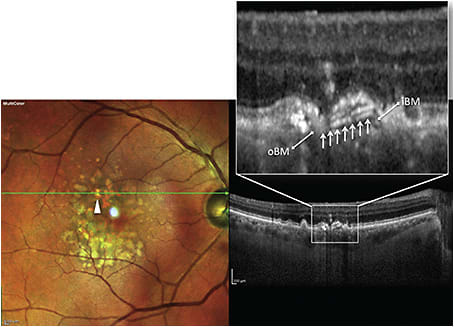
Figure 3. Combined multicolor image and spectral-domain OCT (SD-OCT) scan of type 1 multilaminar hyperreflectivity in a patient with nonexudative AMD. Multicolor image (left) shows a regressing calcific drusen (arrowhead), and tracked SD-OCT image (right) shows an intense multilaminar hyper-reflective signal (arrows) beneath the retinal pigment epithelium (RPE) layer, apparently originating from the inner Bruch’s membrane (iBM) layer (note the underlying outer Bruch’s membrane [oBM] layer).
CREDIT: ELSEVIER
The authors posited that lipids undergoing calcification may give rise to this signal,11 but this material may possibly represent early intra-Bruch’s membrane neo-vascularization.19
Some of the data from AMD histology and FAF studies have been consistent with the notion that RPE abnormalities precede the development of GA.11,12,20 Some clinical and histological data, however, have indicated that photoreceptor abnormalities may play major roles in the evolution of GA.21-24
Using adaptive optics and SD-OCT, Godara et al25 observed areas of hyper-reflectivity coinciding with the location of drusen, but cone structure (ie, cone density, cone arrangement) over drusen seemed to be intact.
Using adaptive optics SLO (AOSLO), however, Boretsky et al26 reported increasing photoreceptor loss with increasing degrees of severity of AMD. Slight disruption of the photoreceptor mosaic was seen over small drusen. Large coalescent drusen and areas of GA exhibited significant decreases in photoreceptor density.27
Combining Modalities. Zayit-Soudry et al27 used AOSLO, SD-OCT, FAF, NIA, and color fundus photographs to correlate cone structure with macular structure in patients with drusen and GA over a 12- to 21-month follow-up interval. They found continuous cone mosaics overlying drusen and up to the edge of GA.
Reduced cone reflectivity often created hyporeflective AOSLO signals over drusen. Areas of reduced cone reflectivity often colocalized with hyporeflectivity of the IS-OS junction overlying drusen in the registered SD-OCT image.
Similar changes in IS-OS junction reflectivity were evident in areas of reduced cone signal reflectivity at the margins of areas of GA (Figure 4). Cone spacing remained within the normal range in most drusen regions and in all of the GA margins.27
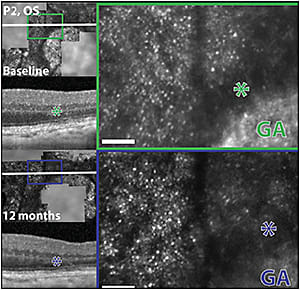
Figure 4. Morphologic features of AOSLO images in retinal areas adjacent to geographic atrophy margins. Left column: AOSLO images from region of interest GA2 from the left eye of patient 2 at baseline and after 12 months of follow up are registered with infrared fundus images and SD-OCT scans. White lines indicate the location of the OCT sections, which skim the edges of the GA regions. The green and dark blue boxes (left) indicate areas of magnified AOSLO images, shown in green and dark blue insets in the right column, respectively. Areas of reduced cone reflectivity, seen as hyporeflective AOSLO signal around the margin of geographic atrophy, correspond to hyporeflectivity of the IS/OS layer in the SD-OCT images (asterisks). Scale bar: 15 arc minutes.
CREDIT: ASSOCIATION FOR RESEARCH IN VISION AND OPHTHALMOLOGY
No correlation existed between the AOSLO dark signal and the presence of adjacent hyperfluorescence on FAF images,27 which was not entirely in accordance with other SD-OCT FAF studies.28
Zayit-Soudry et al27 noted that cone spacing is a specific, but not necessarily a sensitive, measure of the structural integrity of the photoreceptor mosaic, so it may not be a sensitive indicator of disease progression.
They posited that cone hyporeflectivity on AOSLO might result from optical misalignment of the photoreceptors due to topographical changes (eg, dome-shaped elevation of the RPE and photoreceptors over drusen; excavation of the retina over areas of GA) with secondary disruption of the normal vertical arrangement of the photoreceptor cells that alters their wave-guiding characteristics.27,29
Issues With Consistency. These observations do not seem to be fully consistent with reports of AMD histology and some SD-OCT studies showing reduced photoreceptor density over drusen,22,24 but they are consistent with histology demonstrating abnormalities of photoreceptor IS and OS morphology at the edge of GA,11 as well as SD-OCT studies of photoreceptor abnormalities over drusen30 and at the margin of GA.28,31,32
In any case, abnormal morphological features and reflectivity changes in the cone mosaic over drusen and at the edge of GA may represent features of AMD progression that can be tracked reproducibly, quantitatively, and in advance of more obvious changes, such as appearance of altered FAF or changes in visual acuity.
The capacity for reproducible tracking over long periods of time may be quite important for assessing the effects of treatments on conditions that are slowly progressive, such as GA.
Spectral-domain OCT en face imaging of the IS-OS boundary surrounding GA demonstrates the variability of photoreceptor disruption surrounding GA, as well as the usefulness of using this imaging strategy in following disease progression.33
FAF Imaging
Although FAF may provide critical information regarding RPE status in AMD,20,34,35 the results are subject to artifacts associated with cataracts and variability in macular pigment density. As a result, the results of FAF and SD-OCT assessment of the size of areas of GA have not always been concordant.36
Using fluorescence AOSLO imaging, Rossi et al37 detected abnormalities in RPE morphology in AMD eyes, even in areas where FAF appeared to be normal. These findings were consistent with the results of AMD histology38 and may be associated with (or precede) RPE damage and death, as well as photoreceptor death.39
As a result, AOSLO may enable investigators to identify abnormalities in RPE cells and/or overlying photoreceptors before abnormalities in FAF, NIA, or even SD-OCT structural changes are evident, either in the course of the natural history of AMD or treatment.
Microperimetry
Microperimetry measures light differential threshold and fixation patterns over specific retinal loci. Midena et al40 studied 13 patients with early AMD and VA of 20/20, using fundus color photographs, FAF, and microperimetry. Macular sensitivity was decreased over large drusen and over pigment abnormalities. When both characteristics were present, the reduction was even greater. Macular sensitivity was reduced significantly over areas with altered FAF vs areas with normal FAF. As a result, increased FAF in early AMD had a functional correlation that could be quantified with microperimetry.
In areas affected by early AMD, retinal sensitivity is degraded despite normal VA. Midena et al40 proposed that microperimetry and FAF may provide a way to monitor and quantify AMD progression.
Querques et al41 studied correlations of FAF, NIA, OCT, and microperimetry in patients with drusen and GA. They found reduced mean retinal sensitivity in areas of decreased FAF, as well as in areas of increased FAF, compared to areas with normal FAF. Mean retinal sensitivity was decreased in areas of decreased NIA, compared with areas of increased NIA, but areas of increased NIA displayed reduced retinal sensitivity compared with areas of normal NIA. Generally, good correlation existed (Pearson ρ =0.6-0.7) between FAF and NIA patterns for all points graded.
Areas of increased FAF and decreased NIA might characterize a stage of AMD in which the RPE has degenerated with reduction in melanolipofuscin granules (perhaps via autophagy) and in which lipofuscin continues to accumulate.41,42
Both Querques et al41 and Landa et al43 found that low values on microperimetry were likely to be associated with IS-OS junction disruption on SD-OCT. Querques et al41 found that better levels of VA were more likely to be associated with normal FAF and NIA patterns, as well as intact IS-OS junction in the foveal region. In addition, IS-OS junction disruption was often seen in areas of reduced FAF.
Imaging Drusen With SD-OCT
Spectral-domain OCT can be used to assess total drusen volume, including increasing volume as drusen number increases as well as decreasing volume as the early AMD progresses to GA.32,44-48 Drusen volume, as determined by SD-OCT, for example, correlates well with AREDS-determined drusen area and AREDS grade of nonexudative AMD.49
It seems likely that SD-OCT-based imaging will supplant color fundus photography for the assessment of clinical response to experimental treatments for early AMD due to its high reproducibility, ability to provide quantitative information in an automated manner, and high degree of correlation with clinical fundus findings.50
IMAGING GEOGRAPHIC ATROPHY
When using fundus images for purposes of identification, GA can be defined as any sharply demarcated area of apparent absence of RPE with visible choroidal vessels and no signs of neovascular AMD involving a region larger than 175 µm in diameter.51
This definition is consistent with the histopathology of GA, which demonstrates RPE death, overlying photoreceptor atrophy, and subjacent choriocapillaris degeneration.8,11 Areas of GA typically appear first in the extrafoveal region and then progress into the fovea later in the disease.
Central vision becomes affected when atrophic areas involve the parafoveal retina. At this stage, even with the fovea partially intact, scanning text can be impaired, and/or only a portion of a word may be visible. Severe vision loss occurs once atrophy involves the foveola.
Beyond Fundus Photography
The physician can image GA using color fundus photography, but a number of limitations prevent this approach from being quantitative, including: (1) interpatient variability in fundus pigmentation; (2) obscuration due to media opacity; (3) variability of drusen appearance; (4) the presence of small satellite areas of GA that are not detectable with fundus photography; and (5) the absence of three-dimensional anatomic information.41,52
Fundus autofluorescence. The rate of GA progression can be quantified by superimposing a modified ETDRS grid on the foveal center of a color fundus photograph or FAF image.53 Of course, cataract degrades FAF images if short-wavelength incident light is used, as is the case for SLO-FAF (excitation: 488 nm, emission: 500-700 nm). In addition, macular xanthophyll attenuates the incident blue light, as well as the emitted fluorescence signal.54
During the evolution of GA, FAF first increases then decreases in the areas that ultimately develop GA.34,55 One explanation is that dying RPE releases lipofuscin, and adjacent RPE phagocytoses the extracellular lipofuscin, which contributes to increased FAF in this area.
Different patterns of FAF may be associated with different rates of GA progression. In one study, eyes with no FAF abnormalities had the lowest rate of progression, whereas those with diffuse patterns (banded or trickling) had the highest rate of progression.20
Results from another study indicated that while both color fundus photography and FAF were reliable for measuring GA area, interobserver agreement is slightly higher for FAF images.56
Situations in which the physician can anticipate a higher chance of disagreement in grading with color photographs vs FAF include: (1) detecting extension of GA to peripapillary atrophy; (2) detecting islands of spared RPE within large areas of GA; (3) distinguishing depigmentation from atrophy; (4) identifying small areas of GA in regions of drusen regression; and (5) detecting GA in the setting of poor contrast images.56
Imaging photoreceptors. Schmitz-Valckenberg et al51 demonstrated that in areas of GA, the severe reduction in the FAF signal corresponds to areas of severe outer retinal damage and the abrupt transition from a hypo- to a hyper-reflective area in the choriocapillaris below Bruch’s membrane on SD-OCT.
The linear dimension of the IS-OS junction disruption was larger than the width of severe FAF reduction, which may indicate that photoreceptor damage precedes complete RPE cell loss (Figure 5).51
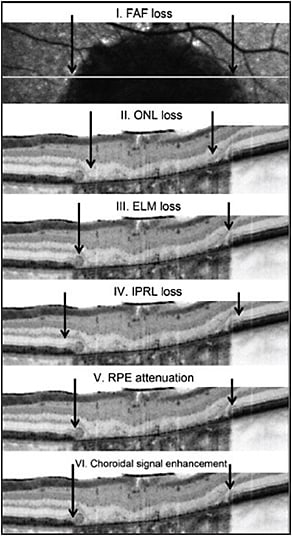
Figure 5. Correlation between FAF and SD-OCT for GA. Within areas of GA, the area of outer nuclear layer (ONL) loss (II) is smaller than the area of FAF loss (I). The area of external limiting membrane (ELM) disruption (III) is greater than the area of ONL loss but smaller than the area of decreased FAF. The area of inner photoreceptor layer (IPRL) disruption (IV) exceeds that of ELM disruption, as well as the area of RPE attenuation (V). The area of RPE attenuation corresponds well with the area of choroidal signal enhancement (VI).
CREDIT: BMJ JOURNALS
Furthermore, the linear dimension of the disruption in the IS-OS signal was greater than that of the outer nuclear layer and the external limiting membrane, which may indicate that photoreceptor damage associated with GA affects the IS and OS before the photoreceptor cell body is irreversibly damaged.51
However, the study by Nunes et al33 used en face OCT imaging to demonstrate the enormous variability in the extent of outer photoreceptor disruption around the margin of GA. They saw no consistency, even within the same eye, but photoreceptor disruption did precede the extension and formation of detectable GA.
Near-infrared autofluorescence. In another study by Schmitz-Valckenberg et al,57 areas of GA had low NIA intensity. In the junctional zone of atrophy, focal areas of increased intensity were present, but these did not often correlate with blue light FAF findings.
The areas of increased NIA at the junctional zone may represent areas of melanolipofuscin accumulation. As a result, increased NIA at the junctional zone might identify patients at high risk of GA enlargement.57
Forte et al17 reported that areas of GA were bright on NIR and FA and dark on FAF and NIA. Areas showing increased FAF or NIA also showed thickening of the RPE layer on SD-OCT.
Areas showing reduced FAF or NIA demonstrated RPE loss on SD-OCT and FA. The hyperautofluorescent margin of areas of GA was never larger on FAF images than on NIA images, while in a minority of cases the hyperautofluorescent margin of areas of GA was larger in NIA than in FAF images.
These marginal areas showed a slight increase in fluorescence on FA and mild choroidal hyper-reflectivity on SD-OCT that was less intense than in the central area of GA (Figure 6). Thus, NIA might detect areas of RPE abnormality/loss at the GA margin earlier than FAF.
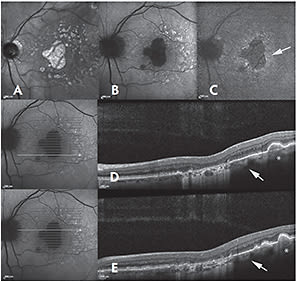
Figure 6. Near-infrared reflectance (NIR) (A), fundus autofluorescence (FAF) (B), and near-infrared autofluorescence (NIA) (C) of a patient with geographic atrophy (GA) and large drusen at the posterior pole. The GA area appears bright on NIR and dark on both FAF and NIA. An increased NIA with normal FAF is present at the GA margin (arrow). In correspondence with large drusen, an increased FAF and a slightly reduced NIA are detectable. On spectral domain optical coherence tomography (D, E), the GA margin shows a slight increase in choroidal reflectivity, although lower than that in the GA area. In correspondence with large drusen, the choroidal reflectivity is also slightly increased (asterisk), likely due to retinal pigment epithelium disruption.
CREDIT: WILEY
Enhanced depth imaging. Using EDI-OCT, Lee et al5 reported that the age-adjusted subfoveal choroidal thickness correlates negatively with BCVA, as well as with the baseline area of GA (as measured with FAF). Enlargement of the GA area was more rapid when the baseline subfoveal choroidal thickness was lower.5
These results are consistent with previous studies demonstrating abnormalities in choroidal blood flow in AMD patients58,59 and may indicate that measurements of choroidal thickness and/or volume could be useful in assessing the response to therapies aimed at slowing the progression of GA.
CONCLUSION
Continued improvement in imaging modalities is needed to assess the efficacy of experimental therapies for AMD (Table, page 57). No modality exists, for example, by which the physician can directly image the biochemistry of Bruch’s membrane (eg, lipid content).
| AMD Event | Imaging Modality |
|---|---|
| Oxidative damage | Mitochondrial flavoprotein autofluorescence |
| Bruch’s membrane changes | SD-OCT, FA |
| RPE and photoreceptor changes* | SD-OCT, FA, FAF, NIA, AOSLO |
| Drusen | SD-OCT, FAF, NIA, FA, AOSLO |
| Geographic atrophy | SD-OCT, pvOCT, FAF, NIA, FA, AOSLO, NIR |
| pvOCT, phase-variance OCT
*Anatomic changes can be probed further with microperimetry |
|
In light of the information presented here, it might be best to focus on changes at the margin of GA (eg, IS-OS junction integrity) rather than the rate of GA expansion when assessing the effects of experimental therapies for GA.
During earlier stages of AMD, SD-OCT provides the best opportunities to follow the volumetric progression of drusen and to study therapies to slow drusen growth and progression to GA and neovascularization. Studies using AOSLO have indicated that we may be able to detect changes in RPE and photoreceptor morphology earlier with this technology than with SD-OCT.
The most sensitive way to assess the early benefits of therapy for dry AMD will be to incorporate these emerging technologies, designed to provide improved anatomic information. RP
Editor’s note: This article will appear in slightly altered form in a forthcoming issue of Developmental Ophthalmology, to be published later this year by S. Karger AG (Basel, Switzerland) and on which Dr. Zarbin is a coeditor. Retinal Physician acknowledges S. Karger for the opportunity to publish this research.
REFERENCES
1. Margolis R, Spaide RF. A pilot study of enhanced depth imaging optical coherence tomography of the choroid in normal eyes. Am J Ophthalmol. 2009;147:811-815.
2. Barteselli G, Chhablani J, El-Emam S, et al. Choroidal volume variations with age, axial length, and sex in healthy subjects: a three-dimensional analysis. Ophthalmology. 2012;119:2572-2578.
3. Manjunath V, Goren J, Fujimoto JG, Duker JS. Analysis of choroidal thickness in age-related macular degeneration using spectral-domain optical coherence tomography. Am J Ophthalmol. 2011;152:663-668.
4. Ko A, Cao S, Pakzad-Vaezi K, et al. Optical coherence tomography-based correlation between choroidal thickness and drusen load in dry age-related macular degeneration. Retina. 2013;33:1005-1010.
5. Lee JY, Lee DH, Yoon YH. Correlation between subfoveal choroidal thickness and the severity or progression of nonexudative age-related macular degeneration. Invest Ophthalmol Vis Sci. 2013;54:7812-7818.
6. Age-Related Eye Disease Study Research Group. The Age-Related Eye Disease Study system for classifying age-related macular degeneration from stereoscopic color fundus photographs: the Age-Related Eye Disease Study Report Number 6. Am J Ophthalmol. 2001;132:668-681.
7. Spaide RF, Curcio CA. Drusen characterization with multimodal imaging. Retina. 2010;30:1441-1454.
8. Green WR, Enger C. Age-related macular degeneration histopathologic studies. The 1992 Lorenz E. Zimmerman Lecture. Ophthalmology. 1993;100:1519-1535.
9. Abdelsalam A, Del Priore L, Zarbin MA. Drusen in age-related macular degeneration: pathogenesis, natural course, and laser photocoagulation-induced regression. Surv Ophthalmol. 1999;44:1-29.
10. Russell SR, Mullins RF, Schneider BL, Hageman GS. Location, substructure, and composition of basal laminar drusen compared with drusen associated with aging and age-related macular degeneration. Am J Ophthalmol. 2000;129:205-214.
11. Sarks JP, Sarks SH, Killingsworth MC. Evolution of geographic atrophy of the retinal pigment epithelium. Eye. 1988;2:552-577.
12. Sarks JP, Sarks SH, Killingsworth MC. Evolution of soft drusen in age-related macular degeneration. Eye. 1994;8(Pt 3):269-283.
13. Zweifel SA, Spaide RF, Curcio CA, Malek G, Imamura Y. Reticular pseudodrusen are subretinal drusenoid deposits. Ophthalmology. 2010;117:303-312.e301.
14. Pauleikhoff D, Harper CA, Marshall J, Bird AC. Aging changes in Bruch’s membrane. A histochemical and morphologic study. Ophthalmology. 1990;97:171-178.
15. Pauleikhoff D, Zuels S, Sheraidah GS, Marshall J, Wessing A, Bird AC. Correlation between biochemical composition and fluorescein binding of deposits in Bruch’s membrane. Ophthalmology. 1992;99:1548-1553.
16. Leng T, Rosenfeld PJ, Gregori G, Puliafito CA, Punjabi OS. Spectral domain optical coherence tomography characteristics of cuticular drusen. Retina. 2009;29:988-993.
17. Forte R, Querques G, Querques L, Massamba N, Le Tien V, Souied EH. Multimodal imaging of dry age-related macular degeneration. Acta Ophthalmol. 2012;90:e281-287.
18. Querques G, Georges A, Ben Moussa N, Sterkers M, Souied E. Appearance of regressing drusen on optical coherence tomography in age-related macular degeneration. Ophthalmology. 2014;121:173-179.
19. Spaide RF. Enhanced depth imaging optical coherence tomography of retinal pigment epithelial detachment in age-related macular degeneration. Am J Ophthalmol. 2009;147:644-652.
20. Holz FG, Bindewald-Wittich A, Fleckenstein M, Dreyhaupt J, Scholl HP, Schmitz-Valckenberg S. Progression of geographic atrophy and impact of fundus autofluorescence patterns in age-related macular degeneration. Am J Ophthalmol. 2007;143:463-472.
21. Cahill MT, Mruthyunjaya P, Bowes Rickman C, Toth CA. Recurrence of retinal pigment epithelial changes after macular translocation with 360 degrees peripheral retinectomy for geographic atrophy. Arch Ophthalmol. 2005;123:935-938.
22. Johnson PT, Brown MN, Pulliam BC, Anderson DH, Johnson LV. Synaptic pathology, altered gene expression, and degeneration in photoreceptors impacted by drusen. Invest Ophthalmol Vis Sci. 2005;46:4788-4795.
23. Curcio CA, Medeiros NE, Millican CL. Photoreceptor loss in age-related macular degeneration. Invest Ophthalmol Vis Sci. 1996;37:1236-1249.
24. Schuman SG, Koreishi AF, Farsiu S, Jung SH, Izatt JA, Toth CA. Photoreceptor layer thinning over drusen in eyes with age-related macular degeneration imaged in vivo with spectral-domain optical coherence tomography. Ophthalmology. 2009;116:488-496.e482.
25. Godara P, Siebe C, Rha J, Michaelides M, Carroll J. Assessing the photoreceptor mosaic over drusen using adaptive optics and SD-OCT. Ophthalmic Surg Lasers Imaging. 2010;41(Suppl):S104-S108.
26. Boretsky A, Khan F, Burnett G, et al. In vivo imaging of photoreceptor disruption associated with age-related macular degeneration: A pilot study. Lasers Surg Med. 2012;44:603-610.
27. Zayit-Soudry S, Duncan JL, Syed R, Menghini M, Roorda AJ. Cone structure imaged with adaptive optics scanning laser ophthalmoscopy in eyes with nonneovascular age-related macular degeneration. Invest Ophthalmol Vis Sci. 2013;54:7498-7509.
28. Brar M, Kozak I, Cheng L, et al. Correlation between spectral-domain optical coherence tomography and fundus autofluorescence at the margins of geographic atrophy. Am J Ophthalmol. 2009;148:439-444.
29. Roorda A, Williams DR. Optical fiber properties of individual human cones. J Vis. 2002;2:404-412.
30. Hartmann KI, Gomez ML, Bartsch DU, Schuster AK, Freeman WR. Effect of change in drusen evolution on photoreceptor inner segment/outer segment junction. Retina. 2012;32:1492-1499.
31. Fleckenstein M, Charbel Issa P, Helb HM, et al. High-resolution spectral domain-OCT imaging in geographic atrophy associated with age-related macular degeneration. Invest Ophthalmol Vis Sci. 2008;49:4137-4144.
32. Bearelly S, Chau FY, Koreishi A, Stinnett SS, Izatt JA, Toth CA. Spectral domain optical coherence tomography imaging of geographic atrophy margins. Ophthalmology. 2009;116:1762-1769.
33. Nunes RP, Gregori G, Yehoshua Z, et al. Predicting the progression of geographic atrophy in age-related macular degeneration with SD-OCT en face imaging of the outer retina. Ophthalmic Surg Lasers Imaging Retin. 2013;44:344-359.
34. von Ruckmann A, Fitzke FW, Bird AC. Fundus autofluorescence in age-related macular disease imaged with a laser scanning ophthalmoscope. Invest Ophthalmol Vis Sci. 1997;38:478-486.
35. Schmitz-Valckenberg S, Bindewald-Wittich A, Dolar-Szczasny J, et al. Correlation between the area of increased autofluorescence surrounding geographic atrophy and disease progression in patients with AMD. Invest Ophthalmol Vis Sci. 2006;47:2648-2654.
36. Sayegh RG, Simader C, Scheschy U, et al. A systematic comparison of spectral-domain optical coherence tomography and fundus autofluorescence in patients with geographic atrophy. Ophthalmology. 2011;118:1844-1851.
37. Rossi EA, Rangel-Fonseca P, Parkins K, et al. In vivo imaging of retinal pigment epithelium cells in age related macular degeneration. Biomed Opt Express. 2013;4:2527-2539.
38. Rudolf M, Vogt SD, Curcio CA, et al. Histologic basis of variations in retinal pigment epithelium autofluorescence in eyes with geographic atrophy. Ophthalmology. 2013;120:821-828.
39. Kaneko H, Dridi S, Tarallo V, et al. DICER1 deficit induces Alu RNA toxicity in age-related macular degeneration. Nature. 2011;471:325-330.
40. Midena E, Vujosevic S, Convento E, Manfre A, Cavarzeran F, Pilotto E. Microperimetry and fundus autofluorescence in patients with early age-related macular degeneration. Br J Ophthalmol. 2007;91:1499-1503.
41. Querques L, Querques G, Forte R, Souied EH. Microperimetric correlations of autofluorescence and optical coherence tomography imaging in dry age-related macular degeneration. Am J Ophthalmol. 2012;153:1110-1115.
42. Kellner U, Kellner S, Weinitz S. Fundus autofluorescence (488 NM) and near-infrared autofluorescence (787 NM) visualize different retinal pigment epithelium alterations in patients with age-related macular degeneration. Retina. 2010;30:6-15.
43. Landa G, Su E, Garcia PM, Seiple WH, Rosen RB. Inner segment-outer segment junctional layer integrity and corresponding retinal sensitivity in dry and wet forms of age-related macular degeneration. Retina. 2011;31:364-370.
44. Jain N, Farsiu S, Khanifar AA, et al. Quantitative comparison of drusen segmented on SD-OCT versus drusen delineated on color fundus photographs. Invest Ophthalmol Vis Sci. 2010;51:4875-4883.
45. Farsiu S, Chiu SJ, O’Connell RV, et al. Quantitative classification of eyes with and without intermediate age-related macular degeneration using optical coherence tomography. Ophthalmology. 2014;121:162-172.
46. Yehoshua Z, Rosenfeld PJ, Gregori G, et al. Progression of geographic atrophy in age-related macular degeneration imaged with spectral domain optical coherence tomography. Ophthalmology. 2011;118:679-686.
47. Yehoshua Z, Wang F, Rosenfeld PJ, Penha FM, Feuer WJ, Gregori G. Natural history of drusen morphology in age-related macular degeneration using spectral domain optical coherence tomography. Ophthalmology. 2011;118:2434-2441.
48. Gregori G, Wang F, Rosenfeld PJ, et al. Spectral domain optical coherence tomography imaging of drusen in nonexudative age-related macular degeneration. Ophthalmology. 2011;118:1373-1379.
49. Freeman SR, Kozak I, Cheng L, et al. Optical coherence tomography-raster scanning and manual segmentation in determining drusen volume in age-related macular degeneration. Retina. 2010;30:431-435.
50. Garcia-Filho CA, Yehoshua Z, Gregori G, et al. Change in drusen volume as a novel clinical trial endpoint for the study of complement inhibition in age-related macular degeneration. Ophthalmic Surg Lasers Imaging Retin. 2014;45:18-31.
51. Schmitz-Valckenberg S, Fleckenstein M, Gobel AP, Hohman TC, Holz FG. Optical coherence tomography and autofluorescence findings in areas with geographic atrophy due to age-related macular degeneration. Invest Ophthalmol Vis Sci. 2011;52:1-6.
52. Sunness JS, Bressler NM, Tian Y, Alexander J, Applegate CA. Measuring geographic atrophy in advanced age-related macular degeneration. Invest Ophthalmol Vis Sci. 1999;40:1761-1769.
53. Mauschitz MM, Fonseca S, Chang P, et al. Topography of geographic atrophy in age-related macular degeneration. Invest Ophthalmol Vis Sci. 2012;53:4932-4939.
54. Schmitz-Valckenberg S, Fleckenstein M, Gobel AP, et al. Evaluation of autofluorescence imaging with the scanning laser ophthalmoscope and the fundus camera in age-related geographic atrophy. Am J Ophthalmol. 2008;146:183-192.
55. Holz FG, Bellman C, Staudt S, Schutt F, Volcker HE. Fundus autofluorescence and development of geographic atrophy in age-related macular degeneration. Invest Ophthalmol Vis Sci. 2001;42:1051-1056.
56. Khanifar AA, Lederer DE, Ghodasra JH, et al. Comparison of color fundus photographs and fundus autofluorescence images in measuring geographic atrophy area. Retina. 2012;32:1884-1891.
57. Schmitz-Valckenberg S, Lara D, Nizari S, et al. Localisation and significance of in vivo near-infrared autofluorescent signal in retinal imaging. Br J Ophthalmol. 2011;95:1134-1139.
58. Grunwald JE, Metelitsina TI, Dupont JC, Ying GS, Maguire MG. Reduced foveolar choroidal blood flow in eyes with increasing AMD severity. Invest Ophthalmol Vis Sci. 2005;46:1033-1038.
59. Berenberg TL, Metelitsina TI, Madow B, et al. The association between drusen extent and foveolar choroidal blood flow in age-related macular degeneration. Retina. 2012;32:25-31.


