PEER REVIEWED
Phototherapy for Diabetic Eye Disease
We know more than ever about the relationships among light, hypoxia, and diabetic retinopathy.
GEOFFREY B. ARDEN, PhD, FRCOphth
Geoffrey B. Arden, PhD, FRCOphthal, is professor emeritus in the Department of Clinical Ophthalmology at University College London and an honorary consultant at Moorfields Eye Hospital in London. He reports no financial interests in products mentioned in this article. Dr. Arden can be reached at geoffreyarden@aol.com. |
Any retinal physician treating DME or AMD will be aware of the immense improvement in outcomes over the last five years following the introduction of ranibizumab (Lucentis, Genentech, South San Francisco, CA), as a number of carefully controlled clinical trials1-6 and reviews have shown.7–9
This constructed antibody blocks the activity of the cytokine vascular endothelial growth factor. Studies have investigated the action of the similar drug bevacizumab (Avastin, Genentech).1,7–9
Follow-up of patients treated with laser showed that even when the treatment was successful, a slow, further decline occurred over a five-year period, while ranibizumab treatment was associated with a sustained increase in VA.10
Moreover, doctors have used ranibizumab to treat a variety of other conditions in which the pathology has some similarity to DME and AMD. We can draw the conclusion that the immediate cause of DME and DR is likely the overproduction of VEGF. But what might be the cause of the excess overproduction of VEGF?
IMPLICATIONS FOR TREATMENT
This matter is not merely of academic interest, because even if VEGF is the immediate cause of the disease, by tracing the sequence of changes leading to its overproduction, it may be possible to discover better methods of treatment.
Ranibizumab is costly to buy and to administer. Moreover, the treatment is not universally successful in removing all retinal swelling.2,11 Patients do not relish injections directly into the eyeball, and although the incidence of adverse effects from a single injection is low,12 they must receive repeated injections.
Various forms of longer-acting drugs or methods of slow release are under investigation.13 But at the moment, the risk of treatment with ranibizumab is sufficient to prevent its use in patients with macular edema not considered to be of “clinical significance” — ie, no lesion within 500 μm of the fovea.
As a result, we can only offer treatment after symptoms appear. It would of course be better to treat at an earlier stage as a first-line treatment, even in diabetics who have no visual symptoms. I will discuss the evidence that such a treatment is available.
Fifteen Years of Knowledge
It may seem surprising that research suggested the causal role of VEGF in these eye conditions as long ago as 1998 (with somewhat tenuous evidence14) and again in 2005,15 when the hypothesis was substantiated.
Evidence that increased VEGF caused DR came from many different types of observations. In a rat that developed type 2 diabetes, the concentration of VEGF was elevated before any vasculopathy developed. Injections of VEGF into animal eyes caused vascular proliferation, leakage, and bleeding.
In patients, operative samples showed that VEGF concentrations increased with disease severity and fell after adequate treatment. Leukocytes incubated in a low-oxygen environment upregulate VEGF production: a small minority of patients with long-term diabetes never develops any retinal vascular changes. In these patients, the ability of leukocytes to respond to hypoxia is greatly reduced.
Genetic Variations
A number of alleles exist of the gene that carries information about the production of VEGF-A. The VEGF molecules produced differ slightly for each allele, and these differences have demonstrable effects on the severity of DR.16–21
If there were many different causes of DR, and the overall contribution of VEGF were smaller, the structural differences between alleles would be unlikely to cause detectable alterations in severity of the disease. Researchers have detailed the mechanism by which VEGF produces vasculopathy.
Other investigations have demonstrated the importance of growing hypoxia in the (mouse and human) retina as dark adaptation proceeds,22–29 while the mild hypoxia caused by sleep apnea or anemia exacerbates DR (for further information, see my papers coauthored with Sivaprasad30–31).
THE ROLE OF PHOTORECEPTORS
Kern and Engerman32 provided the first indication that photoreceptors were important to the production of DR. These authors examined the histology of the brain and retina in dogs made diabetic with injections of streptozotocin or a high-galactose diet (Table 1).
Table 1. Summary of Changes in Small Vessels In the Brains and Retinas of Diabetic Dogs
| Retina | Brain | Normal | |
|---|---|---|---|
| Microaneurysms | 43 | 0 | 0 |
| Pericyte ghosts/1,000 | 25 | 0 | 3 |
| Acellular capillaries | 195 | 0 | 0 |
| Capillary basement (nm) | 237 | 171 | 145 |
Report contains highly statistically significant differences; galactosemic dogs had very similar results.
DATA ADAPTED FROM KERN AND ENGERMAN.32
After five years, the characteristic vascular changes — loss of pericytes, the formation of microaneurysms, and the obliteration of capillaries — appeared in the retina, but were absent in the brain.
Because the retina is an outgrowth of the brain, such significant differences were unexpected: the authors concluded that factors peculiar to the retina cause DR. The main anatomical difference between the retina and brain is that only the former possesses photoreceptors.
Could this be the reason why the retina is susceptible to DR and perhaps other degenerations? What property of photoreceptors is unusual, and could this property be related to the susceptibility of the retina?
HISTORIC INVESTIGATIONS
Otto Warburg first recognized the peculiar biochemistry of the photoreceptors more than 100 years ago, in the dawn of biochemistry. In 1911, he first measured oxygen uptake by various tissues and found that it was greatest in the retina; the brain came a distant third, with less than half of that of retina.
Because at least 50% of the retina consists of neurons, this finding implies that the oxygen uptake of the remainder is very high indeed. This finding impelled Selig Hecht to investigate in 1936 how decreases in the oxygen supply to the retina could affect visual function.
McFarland and Evans measured the change in the absolute threshold of vision (Figure 1A) as a function of the oxygen content of inspired air, calibrated in terms of equivalent feet above sea level.
Evident from these results is that a small reduction in oxygen is sufficient to cause an increase in visual threshold — at approximately 3,000 ft (~1,000 m) the supply of oxygen to the normal eye becomes insufficient.
For comparison, commercial airliners are pressurized to 7,000 ft (~2,500 m), so every passenger has sufficient hypoxia to render the blood supply to the normal retina inadequate. With modern techniques it is possible to demonstrate that the alteration in threshold occurs only a few seconds after the arterial oxygen changes (Figure 1B).
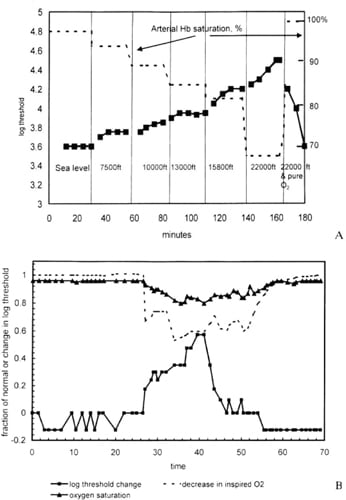
Figure 1. The normal eye in full dark adaptation is highly susceptible to hypoxia; the supply is barely sufficient to maintain full sensitivity. A. Full line and solid squares: visual threshold increases as the oxygen in inspired air decreases. Arterial oxygen saturation is given on the right hand side. Note the equivalent altitudes across the bottom of the figure.
B. Similar results with an expanded time scale in seconds using electronic equipment. The full line with solid squares is the visual threshold, while the dotted line is the oxygen composition of inspired air, and the solid line with triangles is arterial hemoglobin saturation.
COURTESY: AMERICAN SOCIETY OF PHYSIOLOGY
DARK-LIGHT DIFFERENCES
Linsenmeier and his group demonstrated the cause of this alteration,33–35 using oxygen microelectrodes to explore the oxygen tension (pO2) throughout the retina. They found (Figure 2) that in the choroid, pO2 was at arterial levels, but as the electrode withdrew through the rod layer, the oxygen tension dropped rapidly to a minimum at the level of the rod mitochondria and then rose again, as the electrode approached the vascularized inner retina.
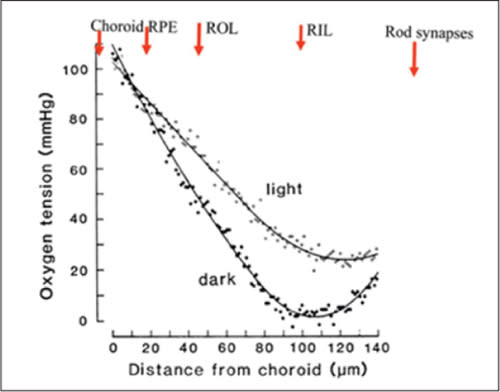
Figure 2. A plot of intraretinal oxygen tension (y-axis) as a function of depth (x-axis) measured from choroid. As the oxygen microelectrode is withdrawn through the RPE and retina, the oxygen tension decreases. Note the difference between dark and light. In darkness, the slope of the reduction is determined by diffusion, indicating that at the level of the rod inner segments, a mechanism for absorbing all of the available oxygen exists. Adapted from Linseinmeier et al.33
COURTESY: BENTHAM SCIENCE
The results differed considerably depending on retinal illumination. In darkness, the fall was steeper, and the minimum approached zero. The choroid acts as an “infinite source” of oxygen: If it is assumed that the mitochondria in darkness are an “infinite sink,” then the maximum change in oxygen tension with electrode position must be equal to the rate at which oxygen can diffuse from the choroid to the mitochondria. In darkness, the experimental data follow this relationship.
Note that from the minimum, a sharp rise occurs in pO2 as the electrode is further withdrawn. This rise is much less pronounced if the experiment occurs in light — the rate of decline is less, and the minimum is at a higher pO2.
Rods and Oxygen
The implication of these results is that, in darkness, rods abstract oxygen from the inner, neural retina, and in light, this abstraction does not occur. When the electrode is at the mitochondria and in darkness, an intense, short flash of light causes an increase in pO2, which is nearly as brief as the electroretinogram.
Linsenmeier et al’s findings came from cats, but primate retinas showed similar results, and other groups have confirmed them.36 Recently, ultrasensitive MRI demonstrated developing hypoxia in the mouse retina during dark adaptation.37
The dark-light difference indicates the cause for this retinal profile: the mitochondria use oxygen to service the excitatory mechanisms of the rods.
Normally, in darkness, the rod outer segment membrane contains channels, which are open and permit the inward flow of ions and water. This flow causes depolarization of the outer segment.
In light, the channels close, and the outer segment repolarizes.38 The entry of ions into the outer segment requires that they be pumped out, and the pumps are located next to the inner segment mitochondria.
In complete darkness, the rod pumps its own volume of fluid in 30 seconds.39 This process produces heat that can be measured, and it requires a great deal of energy. The hyperpolarization of the rods alters synaptic transmitter release at the rod terminal. In this way, the rod signals — a mechanism unique to photoreceptors but one that maximizes sensitivity.40
Linsenmeier found in diabetic cats,35 the oxygen tension was lower than in the controls — even in retinal zones with no capillary dropout. As a result, he provided evidence that not only does darkness increase hypoxia, but that the diabetic state increases inner retinal hypoxia, ie, in that part of the retina in which diabetes causes vascular changes.
HYPOXIA AND DR
The chief factor regulating VEGF production is hypoxia, so a unique property of the rods could relate to the development of DR. If it does, then we would predict that if the photoreceptors were absent, DR would not develop. This is, in fact, the case.
In retinitis pigmentosa, the rods are selectively damaged. It is common knowledge that such patients never develop the vasculopathy of DR if they become diabetic.41
In other cases of mitochondrial disease (eg, maternally inherited diabetes and deafness42,43), a risk of photoreceptor damage also exists. If this damage occurs, then the incidence of DR diminishes.
The same observations have been made in mice without rods (Rho-/-). Rodless diabetic animals suffered less hypoxia and less vascular damage than diabetic control mice.44
Relationship to Sleep Apnea
Another prediction is that reduction in the oxygen supply to the retina would increase the severity of DR. Recently, clinicians have shown that during periods of sleep apnea, oxygen saturation (HbO2) may drop to less than 90% for a period of approximately one minute, called a “dip.”
In obese diabetics, who have more than five such “dips” per night, DR is considerably worse than in control groups without “dips.”45–50 Alternatively, if patients breathe oxygen continuously, the plasma content of oxygen increases, and HbO2 increases by 2% to 3%.
The delivery of oxygen to the retina increases by less than 10%, but a pilot clinical trial showed this increase to be sufficient to reduce DME.51 To place it in context, the oxygen demand of the retina more than doubles in dark adaptation.
THE MECHANISM OF DR CAUSED BY HYPOXIA
But if retinal hypoxia causes DR, what is the mechanism involved? We can propose a model for the development of DR (Figure 3). The hyperglycemia associated with diabetes increases the need for oxygen, while the supply decreases as a result of the thickening of basal membranes caused by advanced glycosylated end-products (AGEs).
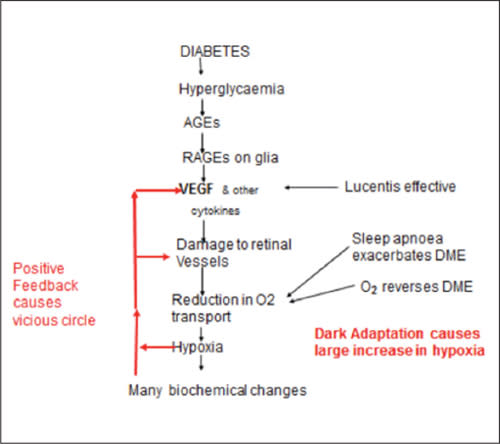
Figure 3. Diagram of the steps initiating diabetic retinopathy. The labels and arrows on the right side of the diagram refer to the evidence in favor of the hypothesis. The “many biochemical changes” in the diagram include oxidative stress, which is widely considered to be the most important cause of DR. This diagram only refers to the way in which DR commences.
As a result, hypoxia occurs, increasing VEGF levels. At first, this increase is significant only in the retina, where hypoxia is the most pronounced. The action of VEGF on small blood vessels causes leakage of fluid into the retina and obliterates capillaries, causing local regions of extra hypoxia and further increasing VEGF production in a vicious cycle.
Figure 3 attempts to answer two further questions. The first is whether hypoxia by itself can start this sequence of events. It appears that some low molecular weight AGEs are chemically active and have receptor sites on Müller cells, which they stimulate to produce VEGF52 and other cytokines, such as connective tissue growth factor (CTGF).53 This may be the initiating event.
The second question regards the role of other biochemical changes associated with diabetes in the production of DR and DME. By far, the most important is the well-attested role of oxidative stress.
OXIDATIVE STRESS
Despite a great deal of work in many centers, no method of reducing oxidative stress has demonstrated substantial benefit in patients, and many believe this lack of benefit is because diabetes affects so many pathways that concentrating on one can have only a small effect.54
Brownlee54 also considered the finding that DR develops only in the retina and not in the brain. He concluded that retinal capillaries are specifically more sensitive to the damage oxidative stress causes.
However, this does not appear to be the case. Indeed, when cultured in high-glucose media, human retinal endothelial cells do not show any evidence of damage related to oxidative stress (Figure 4), while other retinal cells do. 55
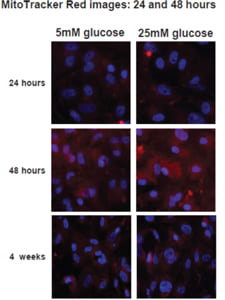
Figure 4. These images show in vivo stains of pure cultures of human retinal endothelial cells in normal and elevated glucose. If oxidative stress occurs, the cells stain red, so these cultures do not show signs of oxidative stress. In vivo, oxidative stress does occur in the retinal endothelium, but this cannot be induced only by hyperglycemia. Adapted from Busik et al.55
COURTESY: SPRINGER
High oxygen turnover leads to the production of the reactive high-energy molecules that cause oxidative stress. It is often assumed that should these high-energy molecules appear in one locus — for example, the large mitochondria of the rapidly respiring rods — the damage can occur in surrounding tissues. However, high-energy oxygen molecules are very short-lived. The lifetime of singlet oxygen is approximately 1 sec and that of triplet oxygen 1 msec.
Even hydrogen peroxide has a similar very short lifetime in the highly reducing environment of the extracellular fluid surrounding rods. Such molecules could diffuse only a few microns from their point of origin before decaying.
An Intracellular Origin
Oxidative stress must arise intracellularly in the class of cells that are damaged.56 In well-developed DR in animal models, the capillary bed is a locus of oxidative stress.
However, the earliest manifestations of oxidative stress appear uniformly throughout the inner retina at a time when evidence of Müller cell activation and retinal leakage has already appeared.
In light of the undoubted changes in DR associated with minor abnormalities of VEGF (eg, the different alleles of VEGF; see above), the contribution of other abnormal metabolites may be secondary. Several recent reviews have covered the topic of oxidative stress in the development of DR.30–31,51,54–55,57,58
DARK ADAPTATION
The theory embodied in Figure 3 allows for predictions about clinical treatment that can be tested directly. If, as reported, small increments in oxygen supply can improve DME, then reduction in oxygen demand should be effective in preventing DME and DR.
The major demand from the retina develops when it is dark-adapted, but in the urban environment, the only time this adaptation occurs is during sleep. Consequently, if patients with early DR or DME were persuaded to sleep not in darkness but in light sufficient to prevent rod dark adaptation, their retinal hypoxia would decrease, and the retinal changes would arrest or reverse.
If other mechanisms were responsible for the development of DME or DR, we could not expect this to occur. Gaynon performed the first investigation, examining the sleeping habits of his long-term (>20 years) diabetic patients who had no retinal changes at all.59 He discovered that 17 of 29 slept in the light.
Data From Clinical Trials
Formal clinical trials have examined this issue. In these trials, every patient received equal “doses” of light, achieved by the wearing of a mask that contained sources of light that illuminated the retina through the closed eyelids.
Local illumination removed the possibility that a patient would cover his or her head during sleep and thus dark-adapt. One eye was illuminated, while the fellow eye acted as a control.
A preliminary phase 1 trial enrolled 10 patients with early diabetic retinopathy to determine whether this form of treatment was acceptable to patients. None of the patients found sleeping with a mask difficult, and all of them completed the three-month trial.
In the end, significant improvements occurred in the number of “dark retinal anomalies” (microaneurysms and dot hemorrhages) in treated eyes relative to the fellow control eyes (Figures 5 and 6). Color contrast sensitivity also improved in trial eyes.60
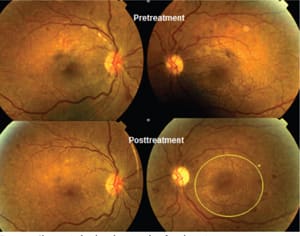
Figure 5 . Changes in fundus photographs of a subject in a phase 1 trial. The trial eye (right eye, on the left) was exposed to local illumination all night, and the fellow (left) eye remained in darkness. Note the extension of DR (at 3 o’clock on the lower right) in the fellow eye, while in the trial eye, the hemorrhages fade during the course of treatment. This effect was quantified by measuring the total area of dark retinal anomalies inside a circle centred on the fovea (yellow outline, lower right). The small yellow circle shows the minimum area of the measurement technique. Measurements were obtained at high magnification.
COURTESY: NATURE PUBLISHING CO.
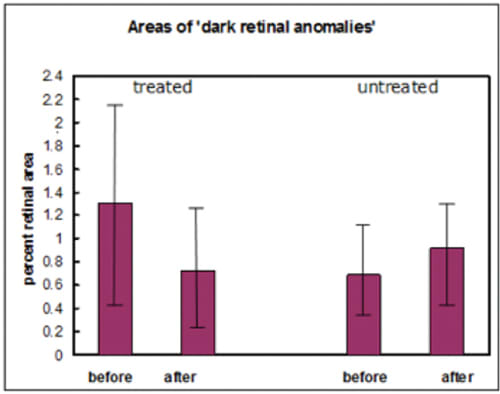
Figure 6. Areas of dark retinal anomalies as a proportion of the total retinal area in a 10-patient trial. Initial measurements (before) and three months later (after) show differences between the treated eyes and untreated eyes. The error bars are the SEM x 2. The before-after difference between treated and untreated is significant at the 1% level.
A phase 2 trial followed61 in 40 patients with clinically nonsignificant DME, which lasted six months. The investigators treated only one eye. The only recruits who did not complete the trial were four in whom the control eye required laser during the trial, as well as subjects who died or were lost to follow-up. The patients were examined with OCT, ETDRS VA charts, and Pelli-Robson contrast charts.
Clinically, rapid improvement occurred as soon as three months (Table 2), ie, before recruitment was finished. An example of OCT from the study appears in Figure 7.
By the end of the trial, there was a significant reduction in retinal thickness except in retinal regions with normal thickness, and retinal cysts resolved. VA at the beginning of the trial was nearly normal, but it improved by the trial’s end, while a slight decrease in VA occurred in the control eyes (Table 3).
The conclusion was that the treatment was effective. Of course, the results of further trials must become available before we can expect general acceptance.62
Table 2. Macular Fluid on OCT: Extent Three Months After Beginning of Trial
| Trial eye | Control eye | P* | |
|---|---|---|---|
| Number improved (a) | 17 | 3 | |
| Number unchanged (b) | 6 | 17 | (a-b) .0002 |
| Number worse (c) | 3 | 6 | (b-c) .685 |
The improved and unchanged numbers are compared for trial and control eyes. The probability is given. So few patients’ retinas deteriorated that the comparison was nonsignificant. Significance was calculated with a two-tailed Fisher’s exact test.
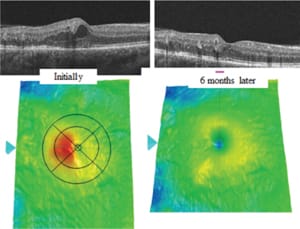
Figure 7. OCT images of a typical lesion, initially showing a local area of swelling, which disappears. Such a disappearance can occur spontaneously in early disease, but in general, the swelling increases.
Table 3. Visual Function in Patients’ Trial and Fellow Eyes.
| Trial Eyes | Fellow Eyes | ||||
|---|---|---|---|---|---|
| Number of letters read | Number of letters read | ||||
| Test | Initial values (mean ± SD) | Final values (mean ± SD) | Initial values (mean ± SD) | Final values (mean ± SD) | Change and 95% CI after six months |
| Visual acuity (ETDRS) | 78.04 7.80 |
80.18 5.32 |
76.52 8.10 |
74.59 8.52 |
4.21 |
| range 85-60 | range 85-60 | range 86-67 | range 87-47 | 2.64-5.78 | |
| Contrast sensitivity (Pelli-Robson) | 31.71 5.39 |
33.14 4.57 |
30.16 4.71 |
30.50 4.95 |
2.00 |
| range 38-20 | range 41-20 | range 36-23 | range 36-20 | 1.25-2.75 | |
The changes between control and trial eyes are shown in column 5, where the value shown = (column 2 - column 1) - (column 4 - column 3).
OTHER CONSIDERATIONS
The evidence presented here is compelling, but light can have other effects on the retina. Reports have appeared regarding the effects in animal models and humans of short-term treatment with long-wavelength light (670 nm), which some research has suggested is neuroprotective.63
This effect might also account for the clinical effectiveness of subthreshold diode micropulse laser therapy (SDM), which is effective against DME while producing no retinal lesions.64,65 The mechanism of action, although unknown, would imply that the schema in Figure 4 requires supplementation.
Light during sleep can be delivered in many ways: the use of local light sources (in face masks) is only one, but ordinary room illumination can be easily adapted. The quantity of light required is that which adapts the rods so that their threshold rises to greater than that of the cones.66
Lighting Options
A simple nonquantitative method is to use blue emitters (peak wavelength 460-490 nm, to avoid “blue light damage”), which when filtered by the lids will provide retinal illumination peaking at 520-540 nm.
If this light appears colored (green), then the cones have detected it. If it appears achromatic, detection is by the rods, so the rods are still more sensitive than the cones; the degree of light adaptation is insufficient and must increase if a therapeutic effect is to occur.
Blue light–emitting diodes can provide more than adequate sources of light for these purposes. For room illumination, a variety of LED luminaires are available. The energy requirement is much greater than that for a face mask. Such treatment is completely noninvasive, and the light required is not of sufficient intensity to affect circadian rhythms.
Diabetic retinopathy is almost unknown in the first five years after the development of diabetes, but after this point, sleeping in light could be beneficial for all patients with diabetes but without retinal changes, as a prophylactic measure.
Although no clinical evidence exists that patients with exudative AMD would benefit from similar advice, the link to overproduction of VEGF is extremely strong. The RPE and Bruch’s membrane complex does not form a barrier to diffusion in youth,33–35 but this is unlikely to be the case in elderly eyes in which the pressure needed to force water through the RPE-Bruch’s complex increases.67
In the fellow eyes of patients with uniocular wet AMD, researchers found evidence that the passage of alcohol from the circulation to RPE was impaired,68 in correlation with the degree of abnormality of standard fundus photographs.
As a result, RPE cells would become hypoxic and produce cytokines that encourage the new growth of choroidal vessels into the retina.69
Because sleeping in dim light does not affect circadian rhythms and is not harmful, we might also recommend this modality to elderly people who have clinical signs suggesting the onset of AMD.
CONCLUSION
Analysis of photoreceptor function, combined with study of the course of deterioration in the eyes of patients with DR, has shown that prevention of dark adaptation would be of therapeutic value in patients with DR and exudative AMD.
Two clinical trials have supported these findings. This type of phototherapy can be offered to prevent the development of disease in patients who are at risk. RP
REFERENCES
1. Subramanian ML, Ness S, Abedi G, et al. Bevacizumab vs ranibizumab for age-related macular degeneration: early results of a prospective double-masked, randomized clinical trial. Am J Ophthalmol. 2009;148:875-878.
2. Diabetic Retinopathy Clinical Research Network; Elman MJ, Aiello LP, Beck RW, et al. Randomized trial evaluating ranibizumab plus prompt or deferred laser or triamcinolone plus prompt laser for diabetic macular edema. Ophthalmology. 2010;117:1064-1077.
3. Nguyen QD, Shah SM, Khwaja AA, et al. Two-year outcomes of the ranibizumab for edema of the macula in diabetes (READ-2) study. Ophthalmology. 2010;117:2146-2151.
4. Subramanian ML, Abedi G, Ness S, et al. Bevacizumab vs ranibizumab for age-related macular degeneration: 1-year outcomes of a prospective, double-masked randomised clinical trial. Eye (Lond). 2010;24:1708-1715.
5. Massin P, Bandello F, Garweg JG, et al. Safety and efficacy of ranibizumab in diabetic macular edema (RESOLVE Study): a 12-month, randomized, controlled, double-masked, multicenter phase II study. Diabetes Care. 2010;33:2399-2405.
6. Michaelides M, Kaines A, Hamilton RD, et al. A prospective randomized trial of intravitreal bevacizumab or laser therapy in the management of diabetic macular oedema. (BOLT study) 12-month data: report 2. Ophthalmology. 2010;117:1078-1086.
7. Stefanini FR, Arevalo JF, Maia M. Bevacizumab for the management of diabetic macular edema. World J Diabetes. 2013;4:19-26.
8. Virgili G, Parravano M, Menchini F, Brunetti M. Antiangiogenic therapy with anti-vascular endothelial growth factor modalities for diabetic macular oedema. Cochrane Database Syst Rev. 2012;12:CD007419.
9. Arevalo JF, Sanchez JG, Lasave AF, et al; Pan-American Collaborative Retina Study Group (PACORES). Intravitreal bevacizumab (Avastin(®)) for diabetic retinopathy at 24-months: the 2008 Juan Verdaguer-Planas Lecture. Curr Diabetes Rev. 2010;6:313-322.
10.Jyothi S, Sivaprasad S. Five-year visual outcome following laser photocoagulation of diabetic macular oedema. Eye (Lond). 2011;25:851-858.
11. Fong AH, Lai TY. Long-term effectiveness of ranibizumab for age-related macular degeneration and diabetic macular edema. Clin Interv Aging. 2013;8:467-483.
12. Semeraro F, Morescalchi F, Parmeggiani F, Arcidiacono B, Costagliola C. Systemic adverse drug reactions secondary to anti-VEGF intravitreal injection in patients with neovascular age-related macular degeneration. Curr Vasc Pharmacol. 2011;9:629-646
13. Stewart MW. Aflibercept (VEGF-TRAP): the next anti-VEGF drug. Inflamm Allergy Drug Targets. 2011;10:497-508.
14. Arden GB, Wolf JE, Tsang Y. Does dark adaptation exacerbate diabetic retinopathy? Evidence and a linking hypothesis. Vision Res. 1998;38:1723-1729.
15. Arden GB, Sidman RL, Arap W, Schlingemann RO. Spare the rod and spoil the eye. Br. J. Ophthalmol. 2005;89:764-769.
16. Awata T, Kurihara S, Takata N, et al. Functional VEGF C-634G polymorphism is associated with development of diabetic macular edema and correlated with macular retinal thickness in type 2 diabetes. Biochem Biophys Res Commun. 2005;333:679-685.
17. Abhary S, Burdon KP, Gupta A, et al. Common sequence variation in the VEGFA gene predicts risk of diabetic retinopathy. Invest Ophthalmol Vis Sci. 2009;50:5552-5582.
18. Agosta E, Lazzeri S, Orlandi P, et al. Pharmacogenetics of antiangiogenic and antineovascular therapies of age-related macular degeneration. Pharmacogenomics. 2012;13:1037-1053.
19. Paine SK, Basu A, Mondal LK, et al. Association of vascular endothelial growth factor, transforming growth factor beta, and interferon gamma gene polymorphisms with proliferative diabetic retinopathy in patients with type 2 diabetes. Mol Vis. 2012;18:2749-2757.
20. Yang X, Deng Y, Gu H, et al. Polymorphisms in the vascular endothelial growth factor gene and the risk of diabetic retinopathy in Chinese patients with type 2 diabetes. Mol Vis. 2011;17:3088-3096.
21. Bleda S, De Haro J, Varela C, Esparza L, Ferruelo A, Acin F. Vascular endothelial growth factor polymorphisms are involved in the late vascular complications in Type II diabetic patients. Diab Vasc Dis Res. 2012;9:68-74.
22. de Gooyer TE, Stevenson KA, Humphries P, Simpson DA, Gardiner TA, Stitt AW. Retinopathy is reduced during experimental diabetes in a mouse model of outer retinal degeneration. Invest Ophthalmol Vis Sci. 2006;47:5561-5568.
23. Curtis TM, Gardiner TA, Stitt AW. Microvascular lesions of diabetic retinopathy: clues towards understanding pathogenesis? Eye (Lond). 2009;23:1496-1508.
24. Caprara C, Grimm C. From oxygen to erythropoietin: relevance of hypoxia for retinal development, health and disease. Prog Retin Eye Res. 2012;31:89-119.
25. Drasdo N, Chiti Z, Owens DR, North RV. Effect of darkness on inner retinal hypoxia in diabetes. Lancet. 2002;359:2251-2253.
26. Wangsa-Wirawan ND, Linsenmeier RA. Retinal oxygen: fundamental and clinical aspects. Arch Ophthalmol. 2003;121:547-557.
27. Rodrigues M, Xin X, Jee K, et al. VEGF secreted by hypoxic Muller cells induces MMP-2 expression and activity in endothelial cells to promote retinal neovascularization in proliferative diabetic retinopathy. Diabetes. 2013 Jul 24. [Epub ahead of print]
28. Wanek J, Teng PY, Blair NP, Shahidi M. Metabolism under normoxia and hypoxia in rat. Invest Ophthalmol Vis Sci. 2013;54:5012-5019.
29. Sepúlveda F. Anemia as a factor related to the progression of proliferative diabetic retinopathy after photocoagulation. Paper presented at: TM’s 3rd World Diabetes & Obesity Online Conference; September 19-21, 2013.
30. Arden GB, Sivaprasad S. Hypoxia and oxidative stress in the causation of diabetic retinopathy. Curr Diabetes Rev. 2011;7:291-304.
31. Arden GB, Sivaprasad S. The pathogenesis of early retinal changes of diabetic retinopathy. Doc Ophthalmol. 2012;124:15-26.
32. Kern TS, Engerman RL. Capillary lesions develop in retina rather than cerebral cortex in diabetes and experimental galactosemia. Arch Ophthalmol. 1996;114:306-310.
33. Braun RD, Linsenmeier RA, Goldstick TK. Oxygen consumption in the inner and outer retina of the cat. Invest Ophthalmol Vis Sci. 1995;36:542-554.
34. Birol G, Wang S, Budzynski E, Wangsa-Wirawan ND, Linsenmeier RA. Oxygen distribution and consumption in the macaque retina. Am J Physiol Heart Circ Physiol. 2007;293:H1696-H1704.
35. Linsenmeier RA, Braun RD, McRipley MA, et al. Retinal hypoxia in long-term diabetic cats. Invest Ophthalmol Vis Sci. 1998;39:1647-1657.
36. Yu DY, Cringle SJ, Su E, Yu PK, Humayun MS, Dorin G. Laser-induced changes in intraretinal oxygen distribution in pigmented rabbits. Invest Ophthalmol Vis Sci. 2005;46:988-999.
37. De La Garza BH, Li G, Shih YY, Duong TQ. Layer-specific manganese-enhanced MRI of the retina in light and dark adaptation. Invest Ophthalmol Vis Sci. 2012;53:4352-4358.
38. Hodgkin AL, McNaughton PA, Nunn BJ, Yau KW. Effect of ions on retinal rods from Bufo marinus. J Physiol. 1984;350:649-680.
39. Hagins WA, Ross PD, Tate L, Yoshikami S. Transduction heats in retinal rods: tests of the role of cGMP by pyroelectric calorimetry. Proc Natl Acad Sci U S A. 1989;86:1224-1228.
40. Falk G, Shiells R. Synaptic transmission: sensitivity control mechanisms. In: Principles and Practice of Clinical Electrophysiology of Vision. 2nd ed. Heckenlively JR, Arden GB, eds. Cambridge, MA; MIT Press; 2006:79-91.
41. Arden GB. The absence of diabetic retinopathy in patients with retinitis pigmentosa: implications for pathophysiology and possible treatment. Br J Ophthalmol. 2001;85:366-370.
42. Smith PR, Bain SC, Good PA, et al. Pigmentary retinal dystrophy and the syndrome of maternally inherited diabetes and deafness caused by the mitochondrial DNA 3243 tRNA(Leu) A to G mutation. Ophthalmology. 1999;106:1101-1108.
43. Holmes-Walker DJ, Mitchell P, Boyages SC Does mitochondrial genome mutation in subjects with maternally inherited diabetes and deafness decrease severity of diabetic retinopathy? Diabet Med. 1998;15:946-952.
44. de Gooyer TE, Stevenson KA, Humphries P, Simpson DA, Gardiner TA, Stitt AW. Retinopathy is reduced during experimental diabetes in a mouse model of outer retinal degeneration. Invest Ophthalmol Vis Sci. 2006;47:5561-5568.
45. Sinclair SH, Malamut R, Delvecchio C, Li W. Diabetic retinopathy: treating systemic conditions aggressively can save sight. Clin J Med. 2005;72:447-454.
46. Shiba T, Sato Y, Takahashi M. [Relationship between proliferative diabetic retinopathy and sleep-disordered breathing]. Nippon Ganka Gakkai Zasshi. 2007;111:899-904.
47. Shiba T, Sato Y, Takahashi M. Relationship between diabetic retinopathy and sleep-disordered breathing. Am J Ophthalmol. 2008;147:1017-1021.
48. West SD, Groves DC, Lipinski HJ, et al. The prevalence of retinopathy in men with Type 2 diabetes and obstructive sleep apnoea. Diabet Med. 2010;27:423-430.
49. Kosseifi S, Bailey B, Price R, Roy TM, Byrd RP Jr, Peiris AN. The association between obstructive sleep apnea syndrome and microvascular complications in well-controlled diabetic patients. Mil Med. 2010;175:913-916.
50. Mason RH, West SD, Kiire CA, et al. High prevalence of sleep disordered breathing in patients with diabetic macular edema. Retina. 2012;32:1791-1798.
51. Nguyen QD, Shah SM, Van Anden E, et al. Supplemental oxygen improves diabetic macular oedema: a pilot study Invest. Ophthalmol Vis Sci 2004;45:617-624.
52. Ye X, Ren H, Zhang M, Sun Z, Jiang AC, Xu G. ERK1/2 signaling pathway in the release of VEGF from Müller cells in diabetes. Invest Ophthalmol Vis Sci. 2012;53:3481-3489.
53. Yang H, Huang Y, Chen X, et al. The role of CTGF in the diabetic rat retina and its relationship with VEGF and TGF-ß(2), elucidated by treatment with CTGF siRNA. Acta Ophthalmol. 2010;88:652-659.
54. Brownlee M. The pathobiology of diabetic complications: a unifying mechanism. Diabetes. 2005;54:1615-1625.
55. Busik JV, Mohr S, Grant MB. Hyperglycaemia-induced reactive oxygen species toxicity to endothelial cells is dependent on paracrine mediators. Diabetes. 2008;57:1952-1965.
56. Ng CF, Schafer FQ, Buettner GR, Rodgers VG. The rate of cellular hydrogen peroxide removal shows dependency on GSH: mathematical insight into in vivo H2O2 and GPx concentrations. Free Radic Res. 2007;411:201-211.
57. Kowluru RA, Chan PS. Oxidative stress and diabetic retinopathy. Exp Diabetes Res. 2007;2007:43603.
58. Kowluru RA, Atasi L, Ho YS. Role of mitochondrial superoxide dismutase in the development of diabetic retinopathy. Invest Ophthalmol Vis Sci. 2006;47:1594-1599.
59. Gaynon M. Should people with prethreshold ROP, BDR or ARMD sleep with a nightlight? Review of factors contributing to retinal hypoxia in retinal and choroidal vascular disease. Invest Ophthalmol Vis Sci. 2007;48:ARVO E-Abstract 4653.
60. Arden GB, Gündüz MK, Kurtenbach A, et al. A Preliminary trial to determine whether prevention of dark adaptation affects the course of early diabetic retinopathy. Eye. 2010;24:1149-1155.
61. Arden GB, Jyothi S, Hogg CH Lee YF, Sivaprasad S. Regression of early diabetic macular oedema is associated with prevention of dark adaptation. Eye. 2011;25:1546-1554.
62. Heckenlively JR. New concept: treating nonproliferative diabetic retinopathy with light adaptation of rods during sleep. Eye. 2011;25:1533-1534.
63. Tang J, Du Y, Lee CA, Talahalli R, Eells JT, Kern TS. Low-intensity far-red light inhibits early lesions that contribute to diabetic retinopathy: in vivo and in vitro. Invest Ophthalmol Vis Sci. 2013;54:3681-3901.
64. Luttrull JK, Dorin G. Subthreshold diode micropulse laser photocoagulation (SDM) as invisible retinal phototherapy for diabetic macular edema: a review. Curr Diabetes Rev. 2012;8:274-284.
65. Vujosevic S, Martini F, Convento E, et al. Subthreshold laser therapy for diabetic macular edema: metabolic and safety issues. Curr Med Chem. 13;20:3267-3271.
66. Arden GB, Wolf JE, Collier J, et al. Dark adaptation is impaired in diabetic before photopic loss can be seen. Can hypoxia contribute to diabetic retinopathy? In: Hollyfield, JG, ed. Retinal Degenerative Diseases and Experimental Therapy. New York, NY; Plenum Press; 1999:305-325.
67. Ugarte M, Hussain AA, Marshall J. An experimental study of the elastic properties of the human Bruch’s membrane-choroid complex: relevance to ageing. Br J. Ophthalmol. 2006;90:621-626.
68. Arden GB, Wolf JE. Differential effects of light and alcohol on the electro-oculographic responses of patients with age-related macular disease. Invest Ophthalmol Vis Sci. 2003;44:3226-3332.
69. Arden GB. Age related macular degeneration. J Brit Menopause Soc. 2006;12:64-70.


