Spectral-domain OCT of the RPE
Optical coherence tomography has evolved to the extent that we can now image the retinal microstructure.
MICHAEL KARAMPELAS, MD, FEBO • DAWN A. SIM, FRCOphth • PEARSE A. KEANE, MD, FRCOphth
Optical coherence tomography is a noninvasive imaging technique that provides high-resolution cross-sectional images of the retina, using light to assess tissue characteristics by measuring the properties of the back-scattered light waves.1,2
In particular, OCT employs interferometry, which uses two separate light beams: the measurement beam and the reference beam. The measurement beam is directed toward the tissue of interest, and the reference beam is directed toward a predefined reference path. The reconvergence of these two light beams produces characteristic interference patterns determined by the optical characteristics of the examined tissue.
The first commercially available OCT systems were based on so-called time-domain technology. In time-domain OCT, a mechanical moving part performed the A-scan, and the information along the longitudinal direction accumulated over the course of the longitudinal scan time. These systems performed 400 axial scans per second and had an axial resolution of 8-10 µm (Figure 1A).
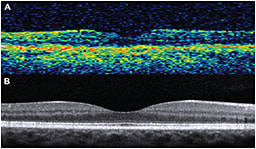
Figure 1. A) Time-domain OCT (Stratus OCT; Carl Zeiss Meditec, Dublin, CA); B) Spectral-domain OCT (Spectralis, Heidelberg Engineering, Carlsbad, CA).
HOW SD-OCT DIFFERS FROM TIME-DOMAIN
In contrast, modern SD-OCT systems do not have mechanically moving parts but implement the mathematical principle of Fourier transformation, measuring all echoes of light simultaneously, compared with sequentially in the case of TD-OCT
As a result, SD-OCT can perform 100,000 to 250,000 axial scans per second, with an axial resolution of 1-5 µm (Figure 1B). SD-OCT has led to faster acquisition times, facilitating the implementation of real-time eye motion tracking and B-scan averaging.
Michael Karampelas, MD, FEBO, Dawn A. Sim, FRCOphth, and Pearse A. Keane, MD, FRCOphth, are on the faculties of National Institute for Health Research Biomedical Research Centre for Ophthalmology, the Moorsfield Eye Hospital of the National Health Service Foundation Trust, and the University College London Institute of Ophthalmology, all in London. None of the authors reports any financial interests in any products mentioned in this article. Dr. Karampelas’ e-mail is Michael.Karampelas@moorfields.nhs.uk.
Spectral-domain OCT also increased the amount of data acquired in each scan, with a significant reduction in motion artifacts and an increased signal-to-noise ratio compared with TD-OCT. All of these characteristics of spectral-domain technology have been successfully implemented in modern OCT systems, providing us with high-resolution imaging of the retina in vivo.
However, we should mention that OCT is based on optical reflectivity, so associations with histological data must be made with caution.
Commercial SD-OCT instruments resolve four bands in the outer retina (Figure 2, page 54). The innermost band corresponds to the external limiting membrane.3 The second band has been attributed to the ellipsoid section of the photoreceptors and the third band to the contact cylinder or interdigitation zone.4

Figure 2. A) Close up of an SD-OCT foveal scan of a normal macula: 1) external limiting membrane; 2) ellipsoid zone; 3) interdigitation zone; 4) RPE/Bruch’s membrane complex. B) Outer retinal hyper-reflective lines manually delineated.
The outermost highly reflective band corresponds to the retinal pigment epithelium/Bruch’s membrane complex. Normally, the RPE and BM are in close apposition and are indistinguishable.
Nevertheless, when these two layers separate due to pathology, they can be visualized as separate bands.5 Such a case is the presence of drusenoid RPE detachments, shown in Figure 3.
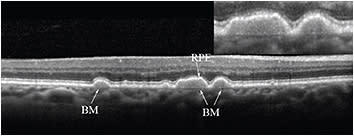
Figure 3. SD-OCT scan in a patient with dry AMD. Drusen are present, in which Bruch’s membrane is visible as a distinct structure from the RPE band.
QUANTITATIVE ANALYSIS OF THE RPE
We recently used SD-OCT to measure RPE/BM complex thickness in patients with early and intermediate dry AMD and age-matched healthy controls.6
We used custom image software to segment the RPE/BM complex band manually (Figure 4), and we calculated the thicknesses for the central, inner macular, and outer macular ETDRS subfields (the central macular subfield has a diameter of 1 mm, the inner macular subfield extends to a circle 3 mm in diameter, and the outer macular subfield extends to a circle 6 mm in diameter).

Figure 4. A) Close-up of an SD-OCT foveal scan in a normal eye. B) The same scan after manual segmentation of the outermost hyper-reflective band, which represents the RPE/Bruch’s membrane complex. The red and green lines delineate the inner and outer borders of the RPE/BM complex, respectively.
Statistical assessment of inter- and intra-observer variability demonstrated that our method was highly reproducible. The Table (page 57) provides a summary of the results for the two groups. The thickness of the RPE/BM complex was statistically significantly thicker in the dry AMD group compared with the age-matched controls in all of the ETDRS subfields.
| Group | Number of eyes | Age (years) (median-range) | RPE/BM thickness in ETDRS subfields (μm) (median-range) | Retinal thickness in ETDRS subfields (μm) (median-range) | ||||
|---|---|---|---|---|---|---|---|---|
| central | inner | outer | central | inner | outer | |||
| Control | 25 | 69 (53-83) | 22.7 (17.5-28.2) | 21.8 (17.7-25.4) | 21.6 (18-24.6) | 243.2 (178.7-315.3) | 306 (282.4-341.4) | 264.8 (241.6-323.5) |
| Dry AMD | 25 | 68 (50-83) | 32.3 (23-47.8) | 30.6 (21-49) | 28.4 (20.3-47.1) | 247.3 (191.8-300.7) | 297.7 (268.1-329.4) | 261.7 (230.7-290.1) |
| RPE/BM: Retinal pigment epithelium/Bruch’s membrane; ETDRS: Early Treatment Diabetic Retinopathy Study; AMD: Age-related macular degeneration | ||||||||
Our Study in Context
A previous study using OCT to evaluate the outer retinal structures in eyes with dry AMD reported a mean RPE/BM thickness of 32.09 µm, which was in agreement with our findings.10
The pathogenesis of AMD involves several overlapping pathways, including oxidative damage, chronic inflammation, and complement dysregulation. The RPE/BM complex has also been implicated in all of these processes.11-13
Despite our finding that the RPE/BM was thicker in the AMD group, the thickness of the neurosensory retina was not different compared with normal eyes (Table, page 57), highlighting the RPE and BM as the main loci of AMD pathogenesis in our cohort.
Histological studies have described in detail the changes that occur in these layers in AMD. They include thickening of BM, as well as accumulation of residual bodies in the RPE.14 Our study used SD-OCT to confirm the thickening of these structures in both early and intermediate dry AMD.
Another interesting finding from our study was that RPE/BM thickness in the normal eyes positively correlated with age in all ETDRS subfields (Figure 5).
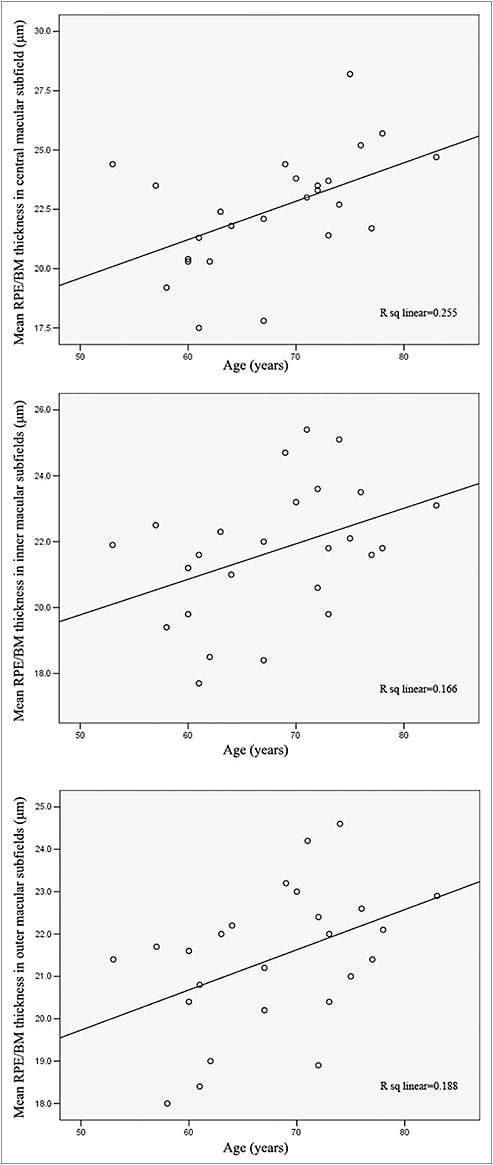
Figure 5. Mean RPE/BM thickness in normal eyes was positively correlated with age in all ETDRS subfields: central (top), inner (middle), and outer (bottom).
This finding confirmed the electron and light microscopy derived data7-9 and established the value of SD-OCT in the quantification of the RPE/BM complex. In contrast, we did not observe such a correlation in the AMD group (Figure 6, page 56), reflecting the divergence between normal aging and AMD, as well as the multifactorial pathogenesis of the latter.
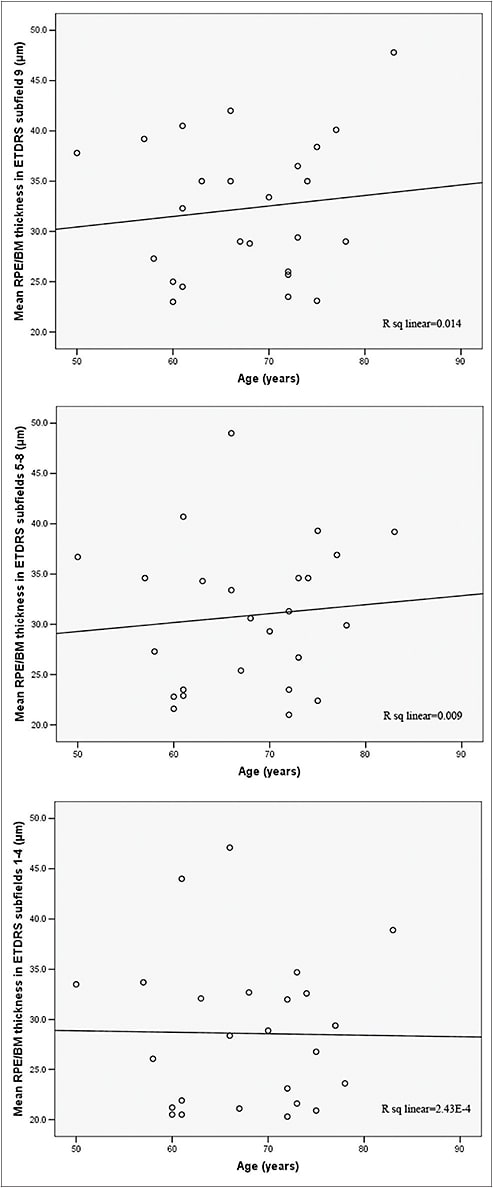
Figure 6. Mean RPE/Bruch’s membrane thickness in the dry AMD group was not correlated with age.
Other Studies
This observed thickening of the RPE/BM complex in eyes with dry AMD compared with normal controls was recently confirmed in another SD-OCT–based study.15 Farsiu et al semiautomatically segmented the RPE/BM layer in eyes with intermediate AMD and in normal controls, to identify quantitative indicators for the presence of AMD via SD-OCT imaging. Their analysis resulted in the definition of specific biomarkers capable of distinguishing AMD from control eyes with high accuracy.
Another recent report used SD-OCT to quantify volumetric changes in drusenoid pigment epithelial detachments and to identify prognostic factors for progression to GA and CNV.16
Four different patterns of progression were observed: PEDs remained unchanged in 50% of eyes; tended to increase in volume before progressing to GA in 31.25% and to CNV in 12.5%; and decreased by more than 50% without progressing to GA or CNV in 6.25%. Risk factors identified included the change in size of a PED, breakdown of the RPE, and the presence of pigment clumps.
QUALITATIVE ANALYSIS OF THE RPE
Apart from the quantitative analysis of the RPE/BM layer, SD-OCT has also proved beneficial in the qualitative analysis of the RPE and adjacent structures.
Intraretinal RPE migration into the neurosensory retina has been extensively described on histopathology for several retinal degenerative disorders. Recent reports using SD-OCT have demonstrated that this phenomenon also appears in AMD.17-20
Hyper-reflective foci, most commonly in the outer nuclear layer or attached to areas of elevated RPE overlying drusen, are seen, and researchers have associated them with areas of pigment clumping on color photographs (Figure 7).
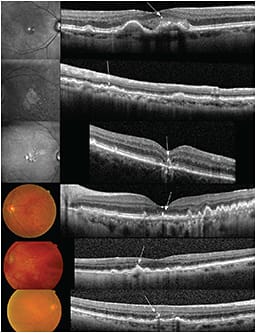
Figure 7. Examples of patients with dry AMD and RPE changes on red-free and color photographs. Corresponding SD-OCT scans demonstrating hyper-reflective foci adjacent to the RPE layer (arrows).
Schuman et al found that 40% of eyes with dry AMD demonstrated the presence of intraretinal RPE migration, while Ho et al showed that, in 73.3% of the eyes, migration was located directly above drusen, suggesting that drusen may play a role in this phenomenon.
Furthermore, the recent AREDS2 trial has incorporated an auxiliary SD-OCT study evaluating RPE abnormalities over time, with a view to identifying early risk factors for disease progression.17
Visualizing RPE Deposits
Spectral-domain OCT has also enhanced visualization and analysis of deposits below or above the RPE. We can see small and intermediate-sized drusen as discrete areas of RPE elevation with variable reflectivity, reflecting the variable composition of the underlying material.
In larger drusen or drusenoid PEDs, a larger elevation of the RPE appears, often dome-shaped, with hypo- or medium-reflective material separating the RPE from the underlying BM (Figure 3, page 54).
One study suggested that fluid accumulation under the retina may sometimes accompany large confluent drusen in the absence of fluoroangiographic evidence of CNV.21 The authors of that study attributed the subretinal fluid in these cases to the mechanical separation of the neurosensory retina from the RPE (Figure 8, page 58).
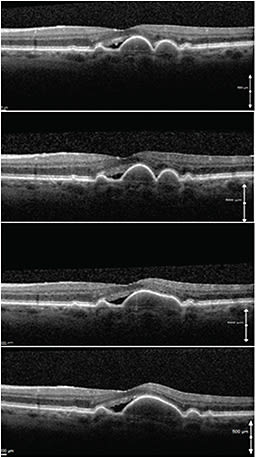
Figure 8. Serial SD-OCT scans of a patient with stable subretinal fluid and stable visual acuity over a period of two years. Note the coalescence of the two drusen into a large drusenoid pigment epithelium detachment and the mechanical strain on the adjacent neuroretina.
Imaging of Pseudodrusen
Spectral-domain OCT has also played a central role in the evaluation of the so-called reticular pseudodrusen.22,23 Klein et al first described reticular pseudodrusen in 1990 as a peculiar yellowish pattern in the maculas of patients with AMD. This pattern was most visible using blue light.24
More recently, SD-OCT studies have demonstrated that reticular pseudodrusen correspond to discrete collections of hyper-reflective material located not under, as is typical with drusen, but above the RPE (Figure 9).22,23

Figure 9. Examples of patients with reticular pseudodrusen. Note the typical reticular pattern of infrared images (center column) and the focal deposits above the RPE.
As a result, the term subretinal drusenoid deposits has been suggested to clarify the existing nomenclature. Furthermore, the Beaver Dam Eye Study identified reticular drusen as a major risk factor for the development of advanced AMD.25
Another important drusen variant occurring in AMD is that of basal laminar drusen, first described by Gass in 1974.26 Basal laminar drusen are small, round, uniformly sized, yellow sub-RPE lesions that show early hyperfluorescence on fluorescein angiography, resulting in a “starry night” appearance, compared to typical drusen seen in AMD, which may fluoresce later in the angiogram.
On SD-OCT, basal laminar drusen, also called “cuticular” drusen, appear as a saw-tooth elevation of the RPE, with rippling (and occasional disruption) of the overlying IS-OS junction and the ELM (Figure 10).

Figure 10. Fundus color photograph (top left), fluorescein angiography (top right), and SD-OCT (bottom) from a patient with basal laminar drusen.
CONCLUSION
SD-OCT has significantly enhanced our understanding of RPE anatomy and function, as well as its changes in different pathologic entities. The evaluation of AMD, a disease the pathogenesis of which is located in RPE and adjacent structures, has greatly benefitted from the advent of SD-OCT.27
The quantitative biometry of the RPE with SD-OCT, as the studies presented in this article demonstrate, represents a current paradigm shift from the traditional AREDS classification system of color photographs toward SD-OCT–based algorithms, for the diagnosis and classification of AMD.
With the continued rapid development of new technologies in the field of imaging, it seems likely that OCT will provide further insights into the pathophysiology and treatment of retinal disease. RP
REFERENCES
1. Huang D, Swanson EA, Lin CP et al. Optical coherence tomography. Science. 1991;254:1178-1181.
2. Hee MR, Izatt JA, Swanson EA et al. Optical coherence tomography of the human retina. Arch Ophthalmol. 1995;113:325-332.
3. Drexler W, Sattmann H, Hermann B et al. Enhanced visualization of macular pathology with the use of ultrahigh resolution optical coherence tomography. Arch Ophthalmol. 2003;121:695-706.
4. Spaide RF, Curcio CA. Anatomical correlates to the bands seen in the outer retina by optical coherence tomography: literature review and model. Retina. 2011;31:1609-1619.
5. Bloom SM, Singal IP. The outer Bruch membrane layer: a previously undescribed spectral-domain optical coherence tomography finding. Retina. 2011;31:316-323.
6. Karampelas M, Sim DA, Keane PA et al. Evaluation of retinal pigment epithelium-Bruch’s membrane complex thickness in dry age-related macular degeneration using optical coherence tomography. Br J Ophthalmol. 2013;97:1256-1261.
7. Okubo A, Rosa RH Jr, Bunce CV, et al. The relationships of age changes in retinal pigment epithelium and Bruch’s membrane. Invest Ophthalmol Vis Sci. 1999;40:443-449.
8. Ramrattan RS, van der Schaft TL, Mooy CM, et al. Morphometric analysis of Bruch’s membrane, the choriocapillaris, and the choroid in aging. Invest Ophthalmol Vis Sci. 1994;35:2857-2864.
9. Spraul CW, Lang GE, Grossniklaus HE, et al. Histologic and morphometric analysis of the choroid, Bruch’s membrane, and retinal pigment epithelium in postmortem eyes with age-related macular degeneration and histologic examination of surgically excised choroidal neovascular membranes. Surv Ophthalmol. 1999;44(Suppl 1):S10-S32.
10. Pappuru RR, Ouyang Y, Nittala MG, et al. Relationship between outer retinal thickness substructures and visual acuity in eyes with dry age-related macular degeneration. Invest Ophthalmol Vis Sci. 2011;52:6743-6748.
11. Shen JK, Dong A, Hackett SF, et al. Oxidative damage in age-related macular degeneration. Histol Histopathol. 2007;22:1301-1308.
12. Donoso LA, Kim D, Frost A, et al. The role of inflammation in the pathogenesis of age-related macular degeneration. Surv Ophthalmol. 2006;51:137-152.
13. Klein RJ, Zeiss C, Chew EY, et al. Complement factor H polymorphism in age-related macular degeneration. Science. 2005;308:385-389.
14. Bird AC. Therapeutic targets in age-related macular disease. J Clin Invest. 2010;120:3033-3041.
15. Farsiu S, Chiu SJ, O’Connell RV, et al; Age-Related Eye Disease Study 2 Ancillary Spectral Domain Optical Coherence Tomography Study Group. Quantitative classification of eyes with and without intermediate age-related macular degeneration using optical coherence tomography. Ophthalmology. 2013 Aug 28. [Epub ahead of print]
16. Alexandre de Amorim Garcia Filho C, Yehoshua Z, Gregori G, Farah ME, Feuer W, Rosenfeld PJ. Spectral-domain optical coherence tomography imaging of drusenoid pigment epithelial detachments. Retina. 2013;33:1558-1566.
17. Schuman SG, Koreishi AF, Farsiu S, et al. Photoreceptor layer thinning over drusen in eyes with age-related macular degeneration imaged in vivo with spectral-domain optical coherence tomography. Ophthalmology. 2009;116:488-496.
18. Fleckenstein M, Charbel Issa P, Helb HM, et al. High resolution spectral domain-OCT imaging in geographic atrophy associated with age-related macular degeneration. Invest Ophthalmol Vis Sci. 2008;49:4137-4144.
19. Pieroni CG, Witkin AJ, Ko TH, et al. Ultrahigh resolution optical coherence tomography in non-exudative age related macular degeneration. Br J Ophthalmol. 2006;90:191-197.
20. Ho J, Witkin AJ, Liu J, et al. Documentation of intraretinal retinal pigment epithelium migration via high-speed ultrahigh-resolution optical coherence tomography. Ophthalmology. 2011;118:687-693.
21. Sikorski BL, Bukowska D, Kaluzny JJ, et al. Drusen with accompanying fluid underneath the sensory retina. Ophthalmology. 2011;118:82-92.
22. Querques G, Canouï-Poitrine F, Coscas F, et al. Analysis of progression of reticular pseudodrusen by spectral domain-optical coherence tomography. Invest Ophthalmol Vis Sci. 2012 Mar 9;53:1264-1270.
23. Schmitz-Valckenberg S, Steinberg JS, Fleckenstein M, Visvalingam S, Brinkmann CK, Holz FG. Combined confocal scanning laser ophthalmoscopy and spectral-domain optical coherence tomography imaging of reticular drusen associated with age-related macular degeneration. Ophthalmology. 2010;117:1169-1176.
24. Mimoun G, Soubrane G, Coscas G. Macular drusen. J Fr Ophthalmol. 1990;13:511-530.
25. Klein R, Meuer SM, Knudtson MD, et al. The epidemiology of retinal reticular drusen. Am J Ophthalmol. 2008;145:317-326
26. Gass JD. A clinicopathologic study of a peculiar foveomacular dystrophy. Trans Am Ophthalmol Soc. 1974;72:139-156
27. Keane PA, Patel PJ, Liakopoulos S, Heussen FM, Sadda SR, Tufail A. Evaluation of age-related macular degeneration with optical coherence tomography. Surv Ophthalmol. 2012;57:389-414.


