New OCT Technologies Take Imaging Deeper and Wider
Adding the possibility of imaging the choroid, retina, and vitreous.
ZOFIA MICHALEWSKA, MD, PhD • JANUSZ MICHALEWSKI, MD • JERZY NAWROCKI, MD, PhD
Since 1991, when optical coherence tomography was first used to evaluate retinal layers in vivo,1 new technologies have contributed to its evolution. The first available OCT instruments (OCT 1) were based on time-domain (TD) technology and had a resolution of 18 μm.
The third generation of TD-OCT instruments achieved an axial resolution of 10 μm and transverse resolution of 15-20 μm. Some authors attempted to improve the software for better image analysis,2,3 while others tried to use different light sources.4
Ultrahigh-resolution (UHR) OCT, introduced in 2004,5 enabled higher transverse resolutions (5-10 μm) by increasing the diameter of the beam entering the eye, decreasing the spot on the retina. In practice, this task was difficult due to light aberration and diffraction.
UHR-OCT uses adaptive optics, which dynamically adjust their optical characteristics to compensate for monochromatic aberrations that occur naturally in the eye. Unfortunately, due to the narrow depth of focus, it was difficult to obtain good-quality images at different depths simultaneously, eg, the nerve fiber layer and photoreceptors.
Although the system dramatically improved our understanding of macular physiology and pathology, it did have some disadvantages, mainly its high cost, and it never became commercially available.
THE ADVENT OF SD-OCT
The next breakthrough, spectral-domain (SD) OCT, incorporates a broadband light source (840 nm). Because SD-OCT obtains A scans using the Fourier transform to detect frequencies, this system enables dramatically faster scan acquisition times and thus allows for three-dimensional imaging.
| Zofia Michalewska, MD, PhD, Janusz Michalewski, MD, and Jerzy Nawrocki, MD, PhD, practice at the Ophthalmic Clinic “Jasne Blonia” in Łód , Poland. The authors report no financial interest in any product mentioned in this article. Dr. Zofia Michalewska can be reached via e-mail at zosia_n@yahoo.com. |

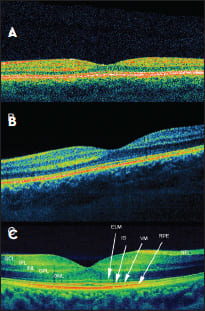
Figure 1. Comparison of different OCT systems in a healthy fovea: A. TD- OCT; B. SD-OCT, 6 μm; C. SD-OCT, 3 μm. NFL - Nerve fiber layer, GCL - ganglion cell layer, IPL - inner plexiform layer, INL - inner nuclear layer, OPL - outer plexiform layer, ONL- outer nuclear layer, ELM - external limiting membrane, IS - ellipsoid inner segments of photoreceptors, VM - Voerhoff’s membrane, RPE - retinal pigment epithelium.
Unlike TD-OCT, SD-OCT does not require a mechanical scan of the optical delay line, as locations of the back-reflecting interfaces are encoded in frequencies of fringes superimposed on the spectrum of the light source. SD-OCT instruments have attained resolutions of 1-3 μm (Figure 1).
For a long time, many believed that it was impossible to visualize structures beneath the retinal pigment epithelium due to signal-attenuating defects and the dense vascular structure of the choroid. Spaide was the first to describe visualization of the choroid after moving the zero-delay line deeper into the eye, effectively focusing the OCT scanner on the choroid instead of the retina.6 This is known as enhanced-depth-imaging (EDI) OCT.
This technique has enabled the visualization of structures lying deeper in the eye. To improve the images, image averaging has been used to achieve high contrast and low speckle noise, resulting in less detailed raster scan images.
Thus, the measurement of several points of the choroid is possible, but current systems cannot reliably create three-dimensional choroid maps because the chorioscleral boundary may not be detected in all cases due to scattering and low penetration through the RPE of the wavelength used. However, some authors have attempted to measure choroidal thickness and volume after manual choroidal segmentation.7
SWEPT-SOURCE OCT
The most recent milestone in the development of retina and choroid visualization strategies is swept-source (SS) OCT, which overcomes the scattering of light on the choroidal vasculature thanks to novel light sources with longer wavelengths than those used in SD systems (1,050 nm vs 840 nm).
SS-OCT obtains time-encoded information by sweeping a narrow bandwidth laser through a broad optical spectrum. SS-OCT detects back-scattered intensity with a photodetector and not with the spectrometer and charge-coupled device camera used in SD-OCT.
Charge-coupled device cameras have a finite pixel size; thus, a drop-off in signal occurs with depth. Using photodetectors instead has led to a further increase in resolution (1 μm). The scan speed in swept-source instruments is twice that of SD-OCT devices (100,000 A scans/sec compared to 50,000 A scans/sec, in general).
This speed facilitates faster acquisition of B scans (Figure 2) and more accurate three-dimensional images of the retina and choroid. The main advantage of SS-OCT when compared to EDI-OCT is that SS-OCT can automatically measure choroidal thickness and create not only retinal-thickness maps but also choroidal thickness maps (Figure 3).
When using commercially available EDI-OCT systems, choroidal thickness must be measured manually at several points, using calipers. Additionally, the new devices enable wider scans than with SD-OCT devices (12 μm vs 9 μm).

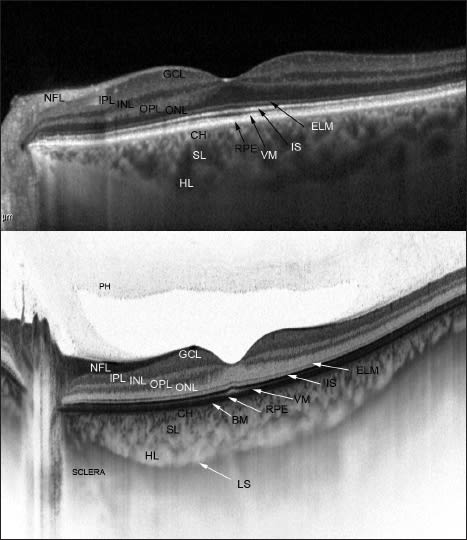
Figure 2. Comparison of different choroid-visualizing OCT systems. Both images present a healthy fovea. EDI-OCT (top). SS-OCT (bottom) enables observation of the vitreous, retina, and choroid during the same examination. Additionally, it enables us to image the lamina suprachoroidea in vivo for the first time. BM - Bruch’s membrane, Ch - choriocapillaris, SL - Sattler’s layer, HL - Haller’s layer, LS - lamina suprachoroidea.
INFORMATION YIELDED BY GOING DEEPER
Until quite recently, indocyanine angiography was the only diagnostic tool for the visualization of choroid blood flow, but this is an invasive intervention and can only present blood flow and not histological sections.
The new SS-OCT confirms histologic data, eg, that the structure of the choroid consists of multiple layers going from the innermost Bruch’s membrane, choriocapillaris, Sattler’s layer (layer of medium-diameter blood vessels), Haller’s layer (outermost layer of the choroid consisting of larger-diameter blood vessels), and lamina suprachoroidea (Figure 2).
Bruch’s membrane is composed of the basal lamina of the RPE, thick collagen, elastic fibers, and thin collagen. It interdigitates with the choriocapillary vascular channels externally, and no potential tissue space exists between Bruch’s membrane and the choriocapillaris, as may exist between its inner boundary and the RPE.
The choroid also consists of arteries and veins, melanocytes, and a supportive connective-tissue framework interspersed with a regulatory nervous system. Precapillary arterioles emanate from a central feeder choroidal arteriole, and each supplies an individual choriocapillary lobule. The arterioles enter the lobule centrally, and venules forming the perimeter of the lobular vascular ring drain into the choroidal veins.
The choriocapillaris has fenestrated vascular walls with a relatively large luminal diameter, which enable visualization of leakage in ICG and fluorescein angiography. A normal potential space exists between the choroid and surrounding sclera posteriorly, but only significant pathologic disorders allow for the creation of a space between Bruch’s membrane and the RPE and between the RPE and the overlying sensory retina.
The lamina suprachoroidea is a structure composed of five to 10 layers of pigmented cells interspersed with multiple layers of flattened fibroblastic cells. Previously, only electron microscope studies had revealed the presence of this structure. Now, SS-OCT has enabled us to identify this structure in vivo.
DEEPER INFORMATION ON RETINAL DISEASE
Several investigators have reported that foveal choroidal thickness correlates with age, axial length, or refractive error in normal subjects.8-10 Recently, researchers have paid greater attention to the role of the choroid in various retinal diseases.
The choroid has a major role in retinal blood supply especially to the macula, which, as an avascular zone receiving 100% of its blood supply from the choroid, may be susceptible to subtle choroid alternations.
Choroidal thickness is comparable between EDI-OCT and SS-OCT,11 and several authors have described choroidal details seen with EDI-OCT. However, SS-OCT is a new diagnostic tool and requires further study. Here we present the possibilities of high-resolution (1 μm) imaging of the vitreous, retina, and choroid with SS-OCT.
Central serous chorioretinopathy
Central serous chorioretinopathy is a macular disorder more often reported affecting men with type-A personalities, characterized by serous pigment epithelial detachment visible as “pooling” of dye in fluorescein angiography. With ICG angiography, the characteristic findings include vascular dilatation and hyperpermeability and punctuate hyperfluorescent spots.

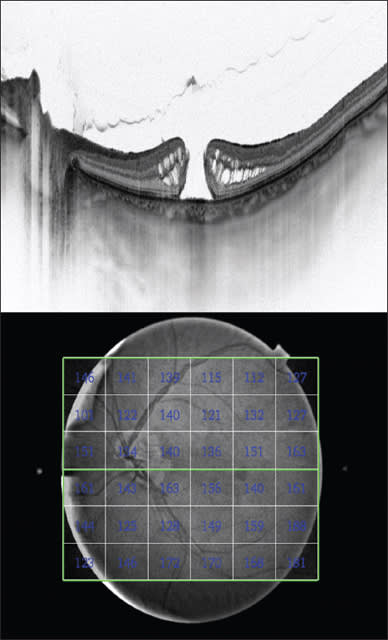
Figure 3. SS-OCT of an eye with idiopathic macular hole (top); and a choroidalthickness map (bottom).
Enhanced-depth-imagining OCT revealed that the choroid is thickened in patients with CSC.12 Some authors reported that treatment with photodynamic therapy enabled them to reduce choroidal thickening,13 whereas laser photocoagulation did not. SS-OCT confirmed that the choroid was thickened in the entire macular area.14

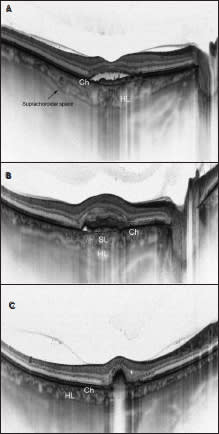
Figure 4. SS-OCT of patients with neovascular AMD. A. Early onset neovascular type 1 AMD in a 66-year-old woman. Subretinal fluid is visible. VA was 0.5 Snellen lines. Even though choroidal thickness seems accurate, the only visible layers are unchanged choriocapillaries and one layer of large-diameter choroidal vessels (Haller’s layer). Sattler’s layer is invisible. B. Neovascular type 2 AMD in a 62-year-old man. This patient previously received one bevacizumab injection. Choroidal thickness seems unchanged, but the architecture of particular layers is damaged. Haller’s layer is thickened, and Sattler’s layer is defectious and invisible in most places. C. SS-OCT of a 58-year-old patient with neovascular type 1 AMD on “on demand” bevacizumab treatment lasting six years. Visual acuity is 0.4 Snellen lines. The choroidal thickness and the thickness of all choroidal layers are decreased. Sattler’s layer is invisible.
An interesting finding is that choroidal thickness is also increased in eyes with spontaneous resolution of the disease. This might explain the tendency for recurrences, typical in eyes with CSC.
Another interesting finding is that additional increases in choroidal thickness have been found at sites corresponding to the leakage seen in FA. This may correspond to increased vessel permeability due to locally increased hydrostatic pressure. The cause is pigment epithelium detachment and finally RPE defects.
AMD
Anti-VEGF drugs were a giant step forward in the treatment of patients with wet AMD, which remains the leading cause of legally defined blindness in developed countries.15,16 However, although these treatments yield impressive results in the short term, they do not prevent RPE atrophy and degeneration over the long term.
Choroidal circulation has an important role in the pathophysiology of AMD. ICG enabled visualization of hypoperfusion in eyes with wet AMD.17 EDI-OCT confirmed that choroidal thickness is decreased in eyes with neovascular AMD and that after anti-VEGF treatment, choroidal thickness further decreased. SS-OCT has allowed us to confirm those findings.
The question remains as to whether this is the natural course of the disease, which is not stopped with anti-VEGF drugs, or a result of using these drugs. Additionally, with SS-OCT, we observed that the thickness of Haller’s layer is increased in eyes with early exudative AMD, probably because hydrostatic pressure is elevated due to increased vessel permeability (Figure 4a).
With time and progression of the disease, an overall decrease in choroidal thickness may be observed. Sattler’s layer becomes almost invisible, and Haller’s layer and the choriocapillaries are atrophic (Figures 4b and c).
Choroidal Nevi and Tumors
Time-domain and SD-OCT had limited value in differentiating nevi from tumors due to their inability to visualize tissue below the RPE. Shah et al. found several EDI-OCT features coexisting with small nevi, including drusen (45%), RPE atrophy (41%), RPE nodularity (8%), subretinal fluid (16%), external limiting membrane irregularity (8%), outer nuclear and outer plexiform layer irregularity (8%), and photoreceptor loss (43%).18
Swept-source OCT may be an even more promising tool than EDI-OCT, as it measures the exact size of the nevus, thus enabling early detection of growth, which is one of the factors enabling early diagnosis of melanoma (Figure 5).
Enhanced-depth-imaging and SS-OCT can additionally identify subretinal fluid more precisely than OCT and ultrasonography. Subretinal fluid was described as a predictor of melanocytic activity.19
Macular Hole
New findings have allowed us to hypothesize that disturbed blood flow may be a contributing factor for susceptibility of the fovea to traction. Nevertheless, controversies exist regarding choroidal thickness measured with EDI-OCT.
Reibaldi et al. and Zeng et al. reported reduced choroidal thickness in cases of idiopathic macular holes and also in fellow unaffected eyes.20,21 In contrast, Schall and coworkers denied this finding.22 These different findings may be due to EDI-OCT only allowing us to take manual measurements of choroid thickness at several points, as it cannot create choroid thickness maps.
Our group recently reported alterations in the outer retina preceding macular hole formation,23 which may develop secondary to choroid dysfunction and not only in correlation with vitreomacular traction. We also confirmed reduced blood flow with a retina flow-meter in cases of idiopathic macular holes (Figure 3).24
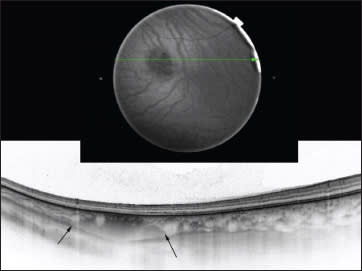
Figure 5. A choroidal nevus on SS-OCT. Fundus image of a choroidal nevus (top); SS-OCT of a choroidal nevus. The margins are indicated with black arrows (bottom).
Acquired Optic Disc Pit in Pathologic Myopia
High myopia is known to be associated with several fovea disorders, such as retinoschisis, macular hole, and neovascularization. With the exception of retinal pigmentary changes around the optic nerve disc, most optic disc changes have not been widely addressed.
Swept-source OCT reveals optic disc pits or conus pits in 16.2% of highly myopic eyes. In most cases, these changes are not visible ophthalmoscopically. In myopic eyes, optic disc pits usually develop in the superior or inferior parts of the disc, contrary to congenital optic pits, which usually develop at the temporal edges.25
CONCLUSION
In a little more than two decades, OCT technology has progressed to the point at which we can visualize the retinal anatomy with a precision not seen before. Swept-source and EDI-OCT allow us to obtain information about the vitreoretinal structures that can guide treatment in common retinal diseases, such as AMD, as well as pathologic myopia and choroidal nevi. With enhanced ability to image the choroid, retina, and vitreous, our diagnostic capabilities are greater than ever. RP
REFERENCES
1. Huang D, Swanson EA, Lin CP, et al. Optical coherence tomography. Science. 1991;254:1178-1181.
2. Adler DC, Ko TH, Fujimoto JG. Speckle reduction in optical coherence tomography images by use of a spatially adaptive wavelet filter. Opt Lett. 2004;29:2878-2880.
3. Sander B, Larsen M, Thrane L, Hougaard JL, Jorgensen TM. Enhanced optical coherence tomography imaging by multiple scan averaging. Br J Ophthalmol. 2005;89:207-212.
4. Drexler W, Morgner U, Ghanta RK, et al. Ultrahigh-resolution ophthalmic optical coherence tomography. Nat Med. 2001;7:502-507.
5. Miller DT, Qu J, Jonnal RS, Thorn K . Coherence gating and adaptive optics in the eye. In: Tuchin VV, Izatt JA, Fujimoto JG, eds. Coherence Domain Methods and Coherence Tomography in Biomedicine VII. Bellingham, WA; Society of Photo-optical Instrumentation Engineers; 2003;4596:65-72.
6. Spaide RF, Koizumi H, Pozzoni MC. Enhanced depth imaging spectral-domain optical coherence tomography. Am J Ophthalmol. 2008;146:496-500.
7. Barteselli G, Chhablani J, El-Emam S et al. Choroidal volume variations with age, axial length, and sex in healthy subjects: a three-dimensional analysis. Ophthalmology. 2012;119:2572-2578.
8. Margolis R, Spaide RF. A pilot study of enhanced depth imaging optical coherence tomography of the choroid in normal eyes. Am J Ophthalmol. 2009;147:811-815.
9. Hirata M, Tsujikawa A, Matsumoto A, et al. Macular choroidal thickness and volume in normal subjects measured by swept-source optical coherence tomography. Invest Ophthalmol Vis Sci. 2011:52:4971-4978.
10. Ikuno Y, Kawaguchi K, Nouchi T, Yasuno Y. Choroidal thickness in healthy Japanese subjects. Invest Ophthalmol Vis Sci. 2010;51:2173-2176.
11. Ikuno Y, Maruko I, Yasuno Y, et al. Reproducibility of retinal and choroidal thickness measurements in enhanced depth imaging and high-penetration optical coherence tomography. Invest Ophthalmol Vis Sci. 2011;52:5536-5540.
12. Imamura Y, Fujiwara, T, Margolis R, Spaide RF. Enhanced depth imaging optical coherence tomography of the choroid in central serous chorioretinopathy. Retina. 2009;29:1469-1473.
13. Maruko I, Iida T, Sugano Y, et al. Subfoveal choroidal thickness after treatment of central serous chorioretinopathy. Ophthalmology. 2010;117:1792-1799.
14. Jirarattanasopa P, Ooto S, Tsujikawa A, et al. Assessment of macular choroidal thickness by optical coherence tomography and angiographic changes in central serous chorioretinopathy. Ophthalmology. 2012;119:1666-1678.
15. Yamazaki T, Koizumi H, Yamagishi T, Kinoshita SO. Subfoveal choroidal thickness after ranibizumab therapy for neovascular age-related macular degeneration: 12-month results. Ophthalmology. 2012;119:1621-1627.
16. Rahman W, Chen FK, Yeoh J, da Cruz L. Enhanced depth imaging of the choroid in patients with neovascular Age-related macular degeneration treated with anti-VEGF therapy versus untreated patients. Graefes Arch Clin Exp Ophthalmol. 2012 Nov 17 [Epub ahead of print]
17. Koizumi H, Iida T, Saito M, et al. Choroidal circulatory disturbances associated with retinal angiomatous proliferation on Indocyanine green angiography. Graefes Arch Clin Exp Ophthalmol. 2008;246:515-520.
18. Shah SU, Kaliki S, Shields CL, Ferenczy SR, Harmon SA, Shields JA. Enhanced depth imaging optical coherence tomography of choroidal nevus in 104 cases. Ophthalmology. 2012;119:1066-1072.
19. Shields CL, Furuta M, Berman EL, et al. Choroidal nevus transformation into melanoma: analysis of 2514 consecutive cases. Arch Ophthalmol. 2009;127:981-987.
20. Reibaldi M, Boscia F, Avitabile T, et al. Enhanced depth imaging optical coherence tomography of the choroid in idiopathic macular hole: A cross-sectional prospective study. Am J Ophthalmol. 2011;151:112-117.
21 Zeng J, Li J, Liu R, et al. Choroidal thickness in both eyes of patients with unilateral idiopathic macular hole. Ophthalmology. 2012;119:2328-2333
22. Schaal KB, Pollithy S, Dithmar S. Is choroidal thickness of importance in idiopathic macular hole? Ophthalmologe. 2012;109:364-368.
23. Michalewska Z, Michalewski J, Sikorski BL, et al. A study of macular hole formation by serial spectral optical coherence tomography. Clin Exp Ophthalmol. 2008;37:373-383.
24. Aras C, Ocakoglu O, Akova N. Foveolar choroidal blood flow in idiopathic macular hole. Int Ophthalmol. 2004;25:225-231.
25. Ohno-Matsui K, Akiba M, Moriyama M, et al. Acquired optic nerve and peripapillary pits in pathologic myopia. Ophthalmology. 2012;119:1685-1692.


