Normative Databases in SD-OCT: A Status Report
A comprehensive look at the evolution of OCT software design and database development.
DANIEL F. KIERNAN, MD ∙ SEENU M. HARIPRASAD, MD
Optical coherence tomography was introduced as a fast, noninvasive ophthalmic imaging technique that made measuring of retinal, macular nerve fiber layer and other ocular structures thicknesses routinely possible. In the early part of the decade, third-generation time-domain OCT 3000 (Stratus OCT, Carl Zeiss Meditec, Dublin, CA) became available with an axial resolution of 10 µm and a scan velocity of 400 axial scans per second. It is still currently the gold standard for posterior-segment retinal tomography, and it has been used in a number of important clinical trials, such as PIER, PrONTO, SCORE and many others.
However, this paradigm is starting to change with the recent introduction of higher resolution spectral-domain OCT into clinical practice. SD-OCT allows for higher resolutions, improved visualization of retinal morphology and retinal pathology,1 and faster scanning times. This is because application of Fourier transformation–based technology allows measurement of all light echoes simultaneously, rather than sequentially, as is the case with time-domain OCT. Thus SD-OCT significantly increases the amount of data acquired in each scanning session, and less interpolation between individual scans is required, allowing volumetric analysis and three-dimensional imaging visualization.
Measurement reproducibility has also been enhanced with software that allows visit-to-visit image registration and, in some systems, overlaying of other studies that permit correlation of OCT images with photographic, angiographic, autofluorescent and other studies. Since the basic premise of this technology is not based on patented proprietary instrumentation, as was the case with time-domain OCT, nine different posterior-segment SD-OCT systems have, or will become, commercially available. Although based on similar spectral-domain technology, each commercial system has its own unique software for determining quantitative measurements of ocular structures; this is one of the most critical aspects in helping clinicians quickly decide whether a particular value is normal or abnormal, as well as whether comparison with previous studies shows improvement or worsening over time.
Thus the size, quality and diversity of an individual system's normative database may influence how acquired data are perceived and acted on by the clinician, potentially altering patient management. This article is a review of commercially available SD-OCT systems, with an emphasis on the available normative databases for anterior- and posterior-segment analysis.
STRATUS TIME-DOMAIN OCT 3000
The Stratus OCT is still the most widely used OCT system in the world for both clinical applications and ocular research. More importantly, it has a well-established track record, with reports indicating an intersession retinal thickness measurement variability of less than 2% and a repeatability coefficient between 1% and 2% when used by an appropriately trained OCT technician.2 Therefore, it is the comparative benchmark for assessing how newer spectral-domain systems function in both a qualitative and quantitative manner. Fortunately, since it has been utilized for so long, there is a plethora of normative data available for both healthy eyes and those with retinal pathology.
In terms of macular and retinal nerve fiber layer (RNFL) analysis, many ophthalmologists are already familiar with the “stoplight display,” with green being the top 5% to 95% of normal, healthy values; yellow being between 1% and 5%; and red being between 0% and 1% (Figure 1). Additionally, pink or white may mean between 95% and 100% of normal values, but white may also mean that there are no normative data available for comparison, as in patients under the age of 20 or above the age of 80.
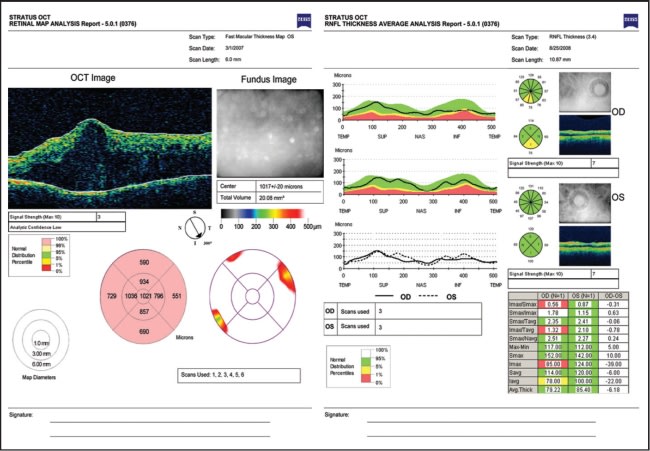
Figure 1. Stratus OCT 3000. Left: Macular thickness analysis in a patient with severe diabetic macular edema. Note the pink designation for “thicker than normative average.” Right: RNFL analysis demonstrating measurement within (left eye) and outside (right eye) normative limits, designated by a “stoplight” designation.
These normative data provide age-matched reference values for macular and RNFL thickness measurements and are derived from a study sponsored by Carl Zeiss Meditec in 2003 after Stratus received Food and Drug Administration approval for clinical use. The study involved approximately 350 subjects with a mean age of 47 (range 20-80) at six sites in the United States. There was a broad representation of ethnic groups, and no significant differences were found between different ethnicities, as well as other demographic factors including gender, geographic location, or right vs left eye.
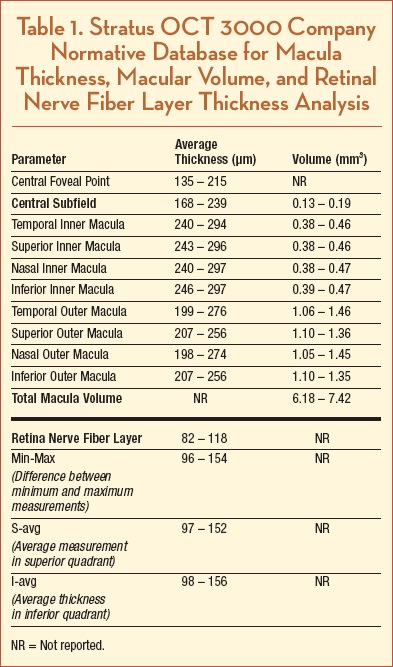
Table 1 lists average thickness measurements for all macular and RNFL zones, although not all of these are used routinely for clinical applications. Average central foveal thickness ranged from 168 to 239 µm, average macular volume ranged from 6.18 to 7.42 mm3, and average RNFL thickness ranged from 82 to 118 µm.3 These data did not include any information about pediatric populations, although normative data for macular thickness using Stratus OCT were reported in a recent study of 56 eyes of healthy children, ages 5 to 16. The authors reported that mean macular thickness was 166 ± 15 µm for the central foveal point, 204 ± 19 µm for the central macula, and 7.11 ± 0.35 mm3 for macular volume.4
In addition to omitting younger eyes, the Stratus OCT normative database also consisted of relatively few subjects of Asian and African descent. A number of studies examining qualitative OCT findings in specific populations have found that a range of averages exists within healthy eyes of different ethnicities. For example, in a study of both African-Americans and Caucasians (17 eyes), average RNFL thickness was 91 µm,5 whereas in another study on only Caucasians (72 eyes) it was 105 µm.6 Two other studies of healthy eyes (118 and 160 eyes, respectively) found that, in a purely Indian population, RNFL thickness was between 102 and 104 µm,7-8 and in two Taiwanese population studies (162 and 250 eyes), thickness was 109 µm in both, which was 10% thicker than that in the Stratus OCT normative database.9-10 The latter study also reported that mean central foveal thickness in the Thai population was 183.2 ± 1.3 µm and thinning of all macular areas, except the center, was found to be significantly associated with advancing age (P<.05).10 This is in contrast with several other studies that found no statistically significant relationship between age and macular thinning.11-13 Another study reported that those of African or Asian descent had thinner macular thicknesses compared to Caucasians (a difference of 18.4 µm, P=.003; −3.9 µm, P=.01, respectively).14
Even in healthy eyes, average RNFL thickness appears to thin with advancing age by about 2.0 to 2.3 µm per decade.10,15 In one of the largest, multicenter, multiethnic studies, of 328 healthy eyes, mean RNFL thickness for the entire population was found to be 100.1 ± 11.6 µm.
Thinner RNFL measurements were associated with older age, being Caucasian vs being either Hispanic or Asian, greater axial length and smaller optic disc area. For every decade of increased age, mean RNFL thickness measured thinner by approximately 2.0 µm; for every 1 mm greater axial length, mean RNFL thickness measured thinner by approximately 2.2 µm; and for every increase in mm2 of optic disc area, mean RNFL thickness increased by approximately 3.3 µm.
Comparisons between ethnic groups demonstrated that Caucasians had mean RNFL values (98.1 ± 10.9 µm) slightly thinner than those of Hispanics (103.7 ± 11.6 µm) or Asians (105.8 ± 9.2 µm). No significant association was found between RNFL thickness and eye or gender.15 Although many of these differences may seem small, they become clinically relevant when trying to decide if a patient with a borderline thickness measurement truly has dis ease, especially in glaucoma suspects. The variability of ethnicity, age and other factors reported for time-domain OCT makes understanding the makeup of SD-OCT normative data even more critical.
CIRRUS HD-OCT
Cirrus OCT (Carl Zeiss Meditec, CZM) is an SD-OCT platform that has a 5-µm axial resolution and scans at 27,000 A-scans per second. Cirrus provides software analysis for macular and optic nerve pathology (Figure 2). For glaucoma and optic nerve studies, an optic disc registration algorithm attempts to automatically center the 1.73-mm radius NFL temporal-superior-nasal-inferior-temporal circle on the disc. A deviation map, overlaid on an OCT fundus image, illustrates where the NFL thickness deviates from a normative database. Preclinical studies provided by CZM demonstrated no significant intervisit variance and excellent repeatability in healthy volunteers (Data on file, copyright 2008, CZM). This was confirmed in a study of 36 eyes of healthy Korean volunteers (mean subject age 28.5 ±5.4 years), which reported that the interclass coefficient (ICC) of the Cirrus HD-OCT was 0.97 and the test-retest variability was 4.5 µm,16which was comparable to or higher than prior reports of Stratus OCT average RNFL thickness ICC values (0.95 to 0.98) and test-retest variability (3.5 to 6.7 µm).17-19
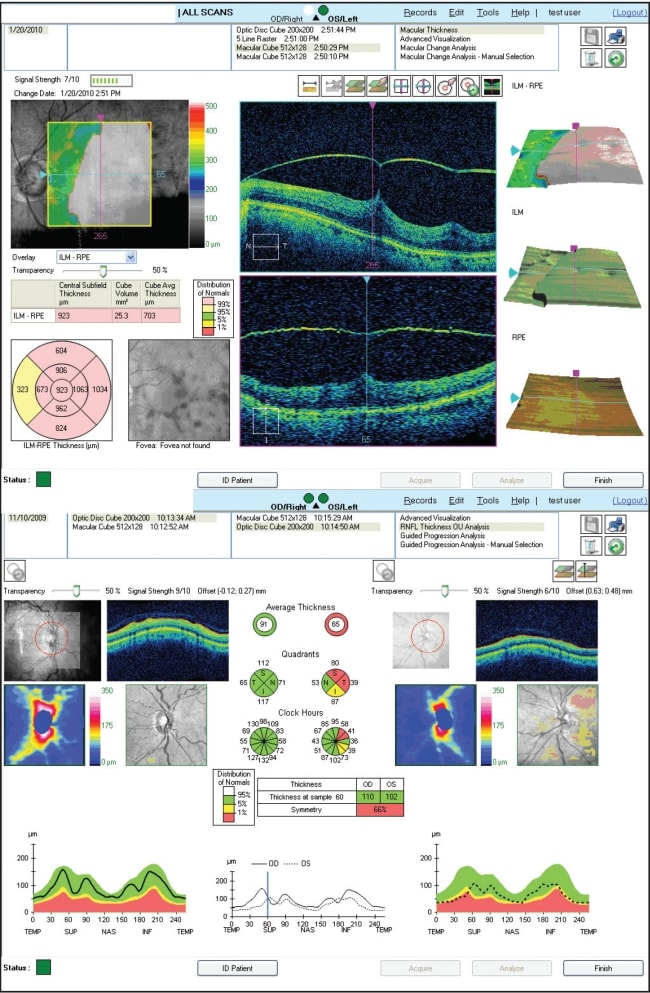
Figure 2. Cirrus HD-OCT. Top: Macular thickness analysis in a patient with vitreomacular traction. Note the pink designation for “thicker than normative average'.” Bottom: RNFL analysis demonstrating measurement within (left eye) and outside (right eye) normative limits, designated by a “stoplight” designation.
The normative database for RNFL and macular thickness was developed by CZM to provide comparative information for assessing patients.20 Seven centers participated in the prospective, nonrandomized, multicenter study to develop the Cirrus RNFL and macula normative databases and involved 284 subjects with an age range of 18 to 84 years, with a mean age of 46.5 years. Enrolled subjects were healthy individuals with no history of eye disease. From these scans, the normative databases for the macular cube and the optic disc cube (RNFL) 200 x 200 scans were created. Regression model analyses were used to estimate the normative limit of each of the parameters adjusted by age. Subjects were grouped into six categories, by subject age: 18 to 29; 30 to 39; 40 to 49; 50 to 59; 60 to 69; and 70 and older. There was a similar gender distribution between groups with 134 males/150 females and 133 males/149 females, respectively.
For all eyes, the mean RNFL thickness (at the mean age of ~46 yrs) was 93 µm, and the mean macular thickness was 256 µm. See Figure 3 for all individual data points by OCT parameter and age. Ethnicity breakdown of the Cirrus RNFL and Macula normative databases is as follows: 43% Caucasians, 24% Asians, 18% African American, 12% Hispanic, 1% Indian, and 6% mixed ethnicity; however, the mean difference between any two race groups was within 6 µm. Caucasians had thinner mean average thickness, superior quadrant average and inferior quadrant average. Asians had thinner mean nasal quadrant average and thicker temporal quadrant average.
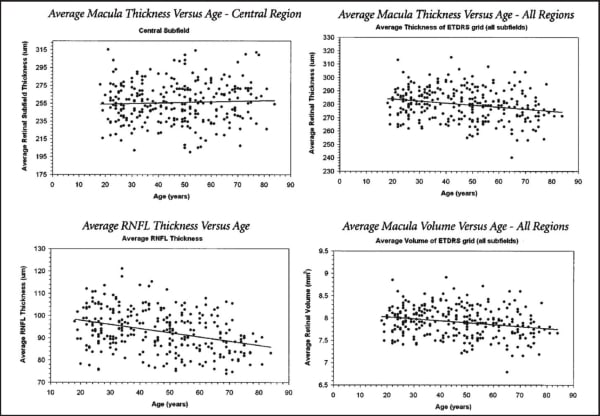
Figure 3. Cirrus HD-OCT. Normative data for macular thickness RNFL comparative analysis, by age group.
The largest difference in RNFL thickness between two race groups was for the temporal quadrant average between Asian and African-American, with a difference of 16 µm. Similar to Stratus OCT, results in patients 70 years of age or older should be interpreted with caution, since only three subjects were included in the normative database who were 80 years of age or older, and only 28 subjects were included who were between 70 and 79 years of age. Also, this normative database does not have any subject younger than 19 years old. Additionally, the Cirrus RNFL and Macula databases do not have subjects with refractive errors outside the –12.00D to +8.00D range. Therefore, the normative limits for subjects with refractive errors outside this range should be used with caution.
Due to segmentation differences, namely the inclusion of the region from the photoreceptor inner segment/outer segment (IS/OS) junction to the RPE, Cirrus measures subfield thickness 43 to 61 µm greater that Stratus.21–24 However, the two OCT instruments cannot be used interchangeably for the measurement of macular thickness or volume. Although one report found a consistent Pearson correlation (0.92) between devices in healthy eyes,21 studies by our group and others reported highly variable correlation in eyes with retinal pathology.22–24 Indeed, in a recent statistical analysis comparing Stratus to several SD-OCT systems, the authors point out that, although a strong correlation is present between Cirrus and Stratus OCT measurements in healthy eyes (r=0.89), the spans of 95% confidence intervals for these regression plots indicate that a straightforward conversion equation to convert spectral/Fourier-domain OCT and Stratus OCT measurements interchangeably is not feasible due to a predictive error of approximately 26 µm per central subfield thickness measurement observed between systems.25
In a recent paper, average RNFL thickness as determined by Cirrus and Stratus was correlated (Pearson r=0.94; P<.001) but was significantly lower with Cirrus (Stratus, 98.0 ±18.0 µm; Cirrus, 85.6 ±14.6 µm; P<.001). This may have been due to different signal strengths, image segmentation algorithms or scan acquisition, registration, data processing and analysis software. Additionally, Cirrus classified a significantly higher percentage of NFL scans as abnormal (Stratus, 12.9%; Cirrus, 23.3%; P<.001) and demonstrated higher sensitivity and specificity (63.6% and 100%) than Stratus OCT (40.0% and 96.7%), based on each of their normative databanks of average NFL thicknesses.26
In another study comparing Stratus to Cirrus, RNFL thickness in 29 normal eyes and 101 eyes with suspected, mild, moderate or severe glaucoma, Stratus OCT measured mean RNFL thickness as 99.4 ±13.2 µm, 94.5 ±15.0 µm, 79.0 ±14.5 µm, 62.7 ±10.2 µm, and 51.0 ± 8.9 µm for the normal, suspect, mild, moderate and severe groups, respectively. For Cirrus OCT, the corresponding measurements were 92.0 ±10.8 µm, 88.1 ±13.5 µm, 73.3 ±11.8 µm, 60.9 ±8.3 µm, and 55.3 ± 6.6 µm, and nearly all Stratus-Cirrus differences were statistically significant (P<.001). There was also a highly significant linear relation ship between Stratus minus Cirrus difference and RNFL thickness, although the systematic difference of Stratus measurements were smaller than Cirrus at thinner RNFL values but larger at thicker RNFL values.27 These studies indicate that, although SD-OCT is very promising for the early detection of glaucoma, intramachine differences preclude direct comparison of RNFL measurements between Cirrus and Stratus OCT.
Despite data suggesting that direct measurement comparison may be impractical, Cirrus RNFL analysis recently received validation in the largest prospective, controlled study to date comparing the sensitivities and specificities of Cirrus and Stratus OCT for detecting RNFL thickness change due to glaucoma. Chang et al. examined 54 glaucoma subjects with early to moderate visual field defects and 50 age-matched normal subjects and determined that the average RNFL thickness at the 5% level for Cirrus had a sensitivity of 83% and specificity of 88%, whereas, at this level, the Stratus had a sensitivity of 80% and a specificity of 94%. For both instruments, the average RNFL at the 1% level improved the specificity to 100%. Defining a cutoff of one or more quadrants abnormal at the 1% level yielded a sensitivity of 87% for Cirrus vs 74% for Stratus, while maintaining a similar specificity of 92% and 94%, respectively, for both instruments. Thus the sensitivity and specificity of various RNFL parameters using the Cirrus OCT for glaucoma detection are excellent and are equivalent to previous generation Stratus OCT.28
Based on a small study suggesting that the foveal pit may not be required for foveal cone specialization,29 normative, quantitative aspects of foveal architecture in 21 emmetropic or myopic (greater than −3 D) eyes was determined and reported for the Stratus and Cirrus OCT systems using an offline analytical technique. The mean foveal depth for Stratus was 113.5 ±5.6 µm, Cirrus 112.5 ±6.0 µm (r=0.9411; P<.0001), foveal diameter for Stratus was 1.905 ±0.049 µm and for Cirrus was 1.912 ±0.056 µm (r=0.8202; P <.0001), and the slope of the fovea for Stratus was 12.1 ±0.52° and for Cirrus was 11.7 ± 0.54° ( r=0.8004; P<.0001). The authors suggested that these normative data may prove useful in quantitatively characterizing the clinical findings of foveal hypoplasia in albinism or foveal plana in otherwise normal patients.30
SPECTRALIS
Spectralis (Heidelberg Engineering, Vista, CA) combines a scanning laser ophthalmoscope with OCT to produce tracking laser tomography that has a 7 µm axial resolution and scans at 40,000 A-scans per second. One beam constantly images and tracks the fundus and acts as a reference, guiding the second beam of light to precisely position the cross-sectional OCT scan. This real-time eye tracking en ables a highly repeatable alignment of OCT and fundus images that can be displayed either in grayscale or false color (Figure 4) and that allows acquisition of 1 to 100 B-scans at the same location, facilitating removal of speckle noise artifact.31 This scanning precision results in very high repeatability and reproducibility, with a very small measurable change (1.5 µm) and coefficient of variation (COV, 0.53%).32
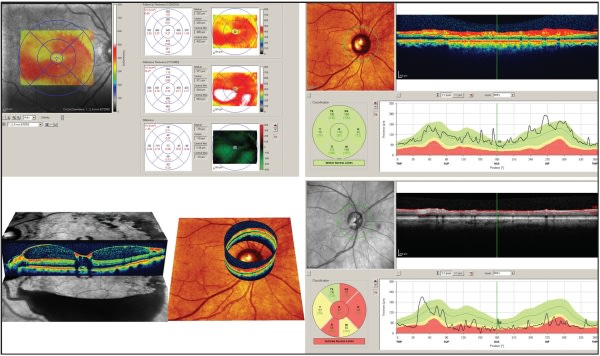
Figure 4. Spectralis SD OCT. Top left: Macular thickness measurement change measured from visit-to-visit in a patient with diabetic macular edema. Bottom left: 3D images of both macular and optic nerve/RNFL thickness. Right images: Normative database analysis of RNFL in a healthy (top) and glaucomatous (bottom) eye. Note the “stoplight” designation for data outside normal limits.
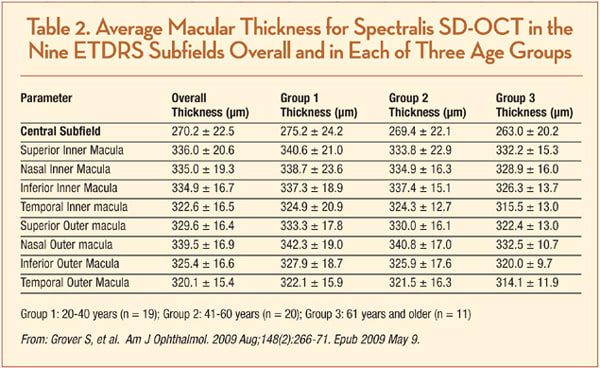
Normative macular thickness data are available for healthy patients, although there is no “official” company database. A prospective study gathering data from 50 healthy subjects, ranging in age from 20 to 84 years and of varied ethnicity, reported all ETDRS field thicknesses across three age stratifications (Table 2). Mean central sub-field thickness of all subjects was 270.2 ±22.5 µm. There were no significant differences in retinal thickness corresponding with age or gender, although the retinal thickness of Asian (279.5 ±27.4 µm) and Caucasian (272.7 ±20.8 µm) subjects tended to be thicker than that of African-American subjects (256.5 ±16.9 µm, P= .007).33
In another study, when compared to Stratus TD-OCT, which measured mean central point thickness (CPT) as 166.9 +20.9 µm and mean central subfield thickness as 202.3 +19.6 µm, Spectralis SD-OCT measured 225.1 +17.1 µm (P<.0001) and 271.4 +19.6 µm (P<.0001), respectively. This equated to a mean difference in the CSF thickness of 69.1 µm, although it ranged from 61.9 µm to 74 µm in the other eight ETDRS subfields, which corresponds to the inclusion of the outer RPE/Bruch's membrane complex by Spectralis OCT.34
In a separate retrospective comparative study of Stratus, Cirrus and Spectralis OCT, Spectralis measured, on average, 69.3 µm greater than Stratus and 20.7 µm greater than Cirrus in healthy eyes. However, the mean difference in measurement varied between 54.9 µm and 109.2 µm greater compared to Stratus and 6.8 µm to 87.3 µm greater compared to Cirrus in eyes with a variety of retinal pathologies. Based on their data compared to other OCT data and histological studies, the authors supported the notion that Spectralis's outer retinal automatic segmentation boundary is near the junction of Bruch's membrane and the choriocapillaris.35
In terms of RNFL thickness, Leung et al. compared the diagnostic agreement and performance for glaucoma detection between the Spectralis SD-OCT and the Heidelberg Retinal Tomograph (HRT; Heidelberg Engineering, Dossenheim, Germany) and reported normative data and data regarding RNFL thickness in glaucomatous eyes. One hundred fifty-five subjects (79 glaucoma patients and 76 normal subjects) were included in the study, and the authors reported a mean RNFL thickness of 104.46 ±10.14 in healthy eyes and 64.85 ±16.69 in eyes with glaucoma (P<.001) (Table 3). They also reported that agreement of categorical classification for glaucoma risk between HRT and Spectralis OCT was fair to moderate (κ = 0.30 – 0.53) and the respective sensitivities of Spectralis OCT and HRT were 91.1% and 79.8% (P=.012) at a similar level of specificity (97.4% and 94.7%).
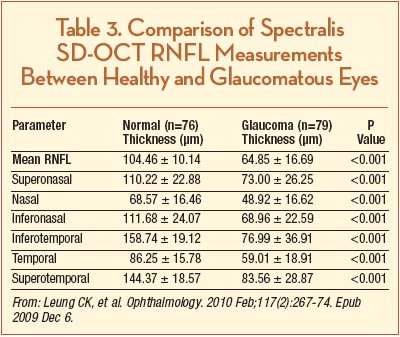
Thus, the diagnostic classification provided by Spectralis OCT and HRT analysis reports may not agree, and although there is a comparable level of specificity, Spectralis OCT RNFL measurements demonstrate higher sensitivity than HRT.36 The normative data that this study reported in healthy eyes agreed with the results from a recently published article that included 170 healthy eyes, which reported a mean RNFL thickness of 97.2 ±9.7 µm. The authors of this report also found that RNFL thickness was significantly negatively correlated with age (r= 0.214, P=.005), with a mean RNFL decrease per decade of 1.90 µm in healthy eyes.37
Another intriguing aspect of the outer retina that has recently been reported is that choroidal thickness can be measured using Spectralis OCT with “enhanced depth imaging.” That is, by positioning the device close enough to the eye to acquire an inverted image within a 5° to 30° area centered at the fovea and then performing manual measurements from the outer border of the RPE to the inner scleral border. Margolis and Spaide reported normative data for 54 eyes with no significant observable ocular pathologic features. The subfoveal choroid was thickest (mean 287 ±76 µm) and grew thinner at more peripheral measurement points. Choroidal thickness demonstrated a negative correlation with age, decreasing approximately 16 µm per 10 years of life.38
In separate papers using the same technique, Spaide reported enhanced depth imaging of choroidal changes underneath a pigmented epithelial detachment in patients with exudative AMD, as well as described a novel disease entity termed “age-related choroidal atrophy.”39–40 The ability to visualize and quantify choroidal thickness is an intriguing area of ophthalmologic study which may be limited to SD-OCT devices such as the Spectralis, which can overcome the technical limitations of imaging deeper structures, such as analog-to-digital conversion, wavelength-dependent light scattering, and signal loss in the image path prior to Fourier transformation.
RTVUE-100
RTVue-100 (Optovue, Fremont, CA) has a 5-µm axial resolution and scans at 26,000 A-scans per second. It allows the option of a 5-by-5 line raster scan, sampled five times each for noise reduction, a 6-by-6 mm grid scan, or en-face 3D scanning capability, all of which are automatically registered to an ETDRS chart. It was the first FDA-approved SD-OCT system in the United States, as well as the first SD-OCT to have developed a large (>1,000 patients) normative database for macular thickness and ganglion cell complex/RNFL analysis, taking into account age and ethnicity, as well as optic disk symmetry and size (Figure 5). This was validated in a study of 37 patients (14 normal and ocular hypertensive subjects, 11 patients with moderate glaucoma, and 12 with severe glaucoma), the intersession reproducibility of RNFL thickness measurements with the RTVue-100 OCT was determined to be satisfactory for diagnostic purposes, in healthy eyes, and in eyes with a variety of glaucoma severity. Furthermore, pupil dilation, age, and experience in imaging examinations did not influence reproducibility in a clinically significant manner.41
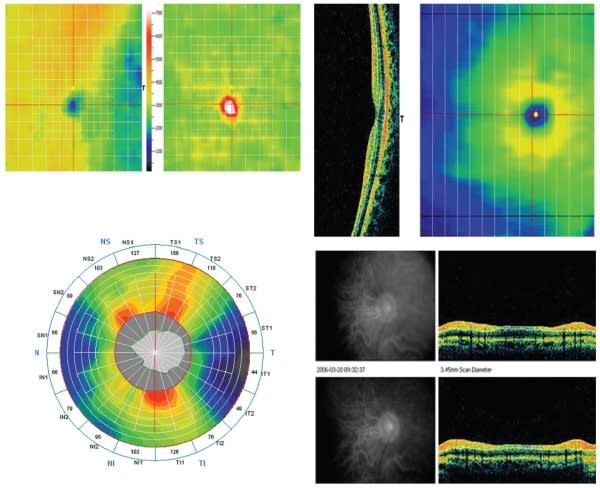
Figure 5. RTVue-100. Top two images: Macular thickness measurement and change over time. Reds and white indicate both thickness and deviation from normal, healthy thickness values. Bottom right two images: RNFL analysis, which takes into account age, ethnicity and optic disc symmetry and size based on a large normative database, in a healthy eye.
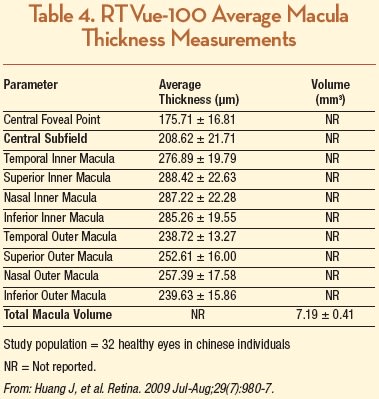
Optovue has not made their normative database publically available at this time and is currently undergoing an FDA-mandated recall of devices which use a normative database. However, several previous studies have reported data for macular and RNFL thickness in healthy eyes. Huang et al. studied 32 eyes from 32 healthy patients using Stratus TD OCT and RTVue-100 and reported the average retinal thicknesses of the nine macular sectors as defined by the ETDRS, as well as foveal center point and macular volume (Table 4). They reported that CST was 208.62 ±21.71 µm, which was significantly greater than Stratus OCT measurement by an average of 14.89 ±13.17 µm, an 8% difference.42 However, the RTVue-100 CST measurements in this study were somewhat less than in another report involving 20 healthy eyes compared between six different OCT devices, where average CST was 245 ±28 µm and 249 ±24 µm in the right and left eyes, respectively.43 Ethnic differences may have been the causative variable, as the former study was carried out in China, and people of Asian descent have thinner maculas compared with Caucasians (and the latter study was from Germany.)14,44
A recent study compared macular inner retinal layer (MIRL) to peripapillary RNFL thickness for glaucoma discrimination ability in healthy controls and patients with normal-tension glaucoma. The authors reported that mean RNFL thickness in healthy eyes (n=65) was 111.8 ±7.8 µm, in eyes with early glaucoma (n=56) was 88.9 ±10.6 µm, and in eyes with advanced glaucoma (n=46) was 78.7 ±11.8 µm (P<.0001 for all values.) Not surprisingly, the authors also demonstrated that, in eyes with advanced glaucomatous damage, RNFL measurement showed a better diagnostic ability than did MIRL measurement.45
A recent observational clinical study designed to assess RTVue NFL thickness and optic disc parameters showed high repeatability and excellent reproducibility in both healthy and glaucomatous eyes. Additionally, there was good correlation in comparison to Stratus OCT, implying that RTVue is likely comparable to Stratus OCT for detecting glaucomatous structural damage; however, RTVue average optic disc measurements were smaller and NFL measurements were thicker than Stratus OCT measurements, although for values of average NFL thickness greater than 110 µm, the relationship tended to invert (that is, Stratus OCT provided greater NFL thickness measurements than RTVue). This suggests that measurements obtained with these two devices are not interchangeable.46
Another study compared the repeatability of RTVue-100 to a well-established device for following glaucoma patients, scanning laser polarimetry (GDx), for imaging RNFL thickness measurements in one eye of each of 37 participants (14 normal and ocular hypertensive subjects, 11 patients with moderate glaucoma, and 12 with severe glaucoma). The average RNFL thickness coefficient of variation was lower with RTVue (2.11%) than with GDx-ECC (3.22%, P=.004), for all participants, indicating that repeatability of RTVue SD-OCT is better than that of GDx.47
3D-OCT 1000
3D-OCT 1000 (Topcon, Paramus, NJ) has a 6-µm axial resolution and scans at 18,000 A-scans per second. Posterior-segment acquisition options include a 6-by-6 mm, 4.5-by-4.5 mm, or 3-by-3 mm volume cube scans, as well as a 3D-rendering mode.
Topcon has an established normative database for both macular and RNFL thickness analysis, but it is currently only available outside of the United States pending FDA approval. However, there are several published reports that may provide a basis of comparison for ophthalmologists who use the system.
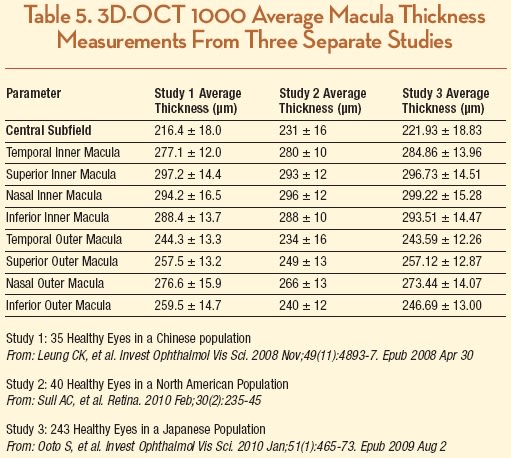
A study conducted in China that involved 35 healthy eyes comparing Stratus to 3D-OCT demonstrated better repeatability for total and regional macular thicknesses for the 3D-OCT. The authors demonstrated that the mean foveal thickness of 3D-OCT is greater than measurements taken with Stratus OCT (216.4 ±18.0 µm and 195.6 ± 17.2 µm, respectively, in 35 healthy normal subjects) and suggested that it was due to a more posterior outer reference boundary. Curiously, average total macular thickness measurements were similar: 263.2 ± 12.6 µm with 3D-OCT and 260.0 ±12.2 µm with Stratus OCT.48 The authors concluded that the SD-OCT has better measurement repeatability compared with time-domain OCT and also suggested that macular measurements obtained from theses two OCT systems may not be used interchangeably.
In a second study from New England that included 40 eyes from normal, healthy volunteers, average CST was 231 ±16 µm, and there was minor variation in each OCT zone when compared to the other study.25 These two studies were similar to a larger, more recent one that studied 248 normal eyes of 248 Japanese subjects and found that mean foveal thickness was 222 ±19 µm; however, the authors found that it was significantly greater in men (226 ±19 µm) than in women (218 ±18 µm; P=.002), although it did not correlate with age in either sex (Table 5).49
Costa-Cunha et al. analyzed RNFL and macular thick ness measurements in patients with band atrophy and temporal visual field defects from chiasmal compression due to intracranial tumors using both 3D-OCT-1000 and Stratus OCT. They found that average RNFL and macular thickness measurements were generally smaller with 3D-OCT-1000 compared to Stratus in diseased eyes (NFL= 58.14 ±14.89 µm and 65.62 ±13.31 µm; macular thickness= 222.40 ±10.81 µm and 225.23 ±12.70 µm, respectively) and age-matched controls (RNFL= 89.91 ±6.93 µm and 104.59 ±8.49 µm; macular thickness= 247.13 ±14.77 µm and 250.61 ±14.01 µm, respectively).
Although the authors determined that SD-OCT technology did not enhance detection of optic nerve band atrophy, their work did provide normative data in healthy individuals.50 Topcon is expected to start marketing a newer version of their system, the 3D OCT-2000, following final FDA approval. No information is available at this time regarding potential changes to their normative data.
SPECTRAL OCT/SLO
Similar to the Spectralis, the Spectral OCT/SLO (Opko/ OTI, Miami, FL) is a combination OCT and confocal SLO designed to image vitreous, retinal and choroidal structures for accurate point-to-point registration and orientation. It has a 5-µm axial resolution and scans at 27,000 A-scans per second. The tomography map is produced from a sequence of B-scans and the macular analysis is viewed as 5-by-5 or 8-by-8 cubed grids over 6-by-6 mm. Retinal maps can be viewed as a 3D volume cube, and sectional cuts can be extracted to identify structures and pathology below the retinal surface. A unique feature of the system is the ability to perform microperimetry, providing quantifiable measurements and difference mapping of a patient's visual function correlated with inner retina pathology.
Opko has sponsored research to develop a normalized database for their device's microperimetric analysis, based on a Goldman III stimulus size, 200-ms stimulus duration, and a 1,500-ms interval between stimuli presentation, in order to serve as age-matched controls to be used as a reference point for evaluation of patients with macular disease. All subjects selected to participate were healthy and had normal visual acuity (20/25 or better), with either normal or mild to moderate hyperopic or myopic correction (+3.00 D to −10.00 D). Mean retinal sensitivity was calculated for 182 healthy eyes that had been categorized evenly into age brackets by decade. Within the central 11° of the macula, 28 points were organized into three circles: a central circle with four points, a middle circle with 12 points, and an outer circle with 12 points. Using automated eye tracking to maintain precise placement of the stimulus on the desired testing points, data were recorded for percentage of points within 2° and 4° of fixation.
The overall mean for retinal sensitivity at all points was 18.09 db (scale range, 0 to 20 db), and there was no statistically significant decline in sensitivity with increasing age in the different brackets. Also, there was no statistically significant decrease in the measured sensitivity between the three circles. Fixation for all age categories was 98% within 4° of fixation, and 91% within 2° of fixation. Test time ranged from 4 to 11.5 minutes, with the mean 5.9 minutes (Figure 6). According to Opko, microperimetry with this instrument is a reproducible and accurate way to measure macular sensitivity around central fixation.51
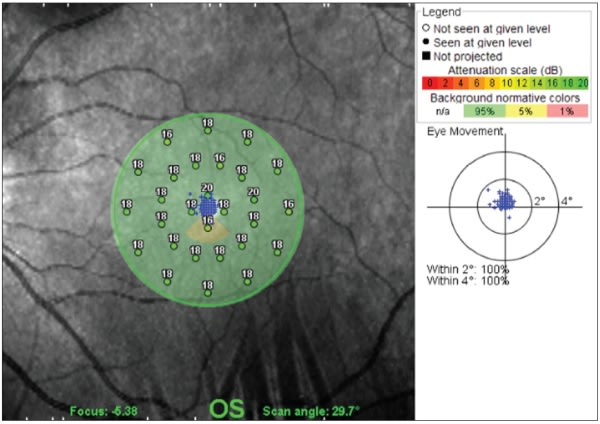
Figure 6. Spectral OCT/SLO. Microperimetry of central 11° of the macula in a normal eye.
In terms of macular thickness, one group compared this device to Stratus OCT in the eyes of Italian subjects that were either normal (n=52) or had macular edema (n=30) or high myopia (n=10) and found the mean CST to be 281 ±166 µm with OCT/SLO, which was greater by 39.2 µm compared to Stratus OCT, with a variable correlation of retinal thickness measurements depending on the presence or absence of artifacts (r=0.59 or 0.84, respectively, P<.001).52 However, this article grouped both normal and eyes with macular edema together; another report comparing several different SD-OCT devices in 20 eyes of healthy Swiss patients found that Spectral OCT/SLO had an average CST of 244 ± 25 µm.43
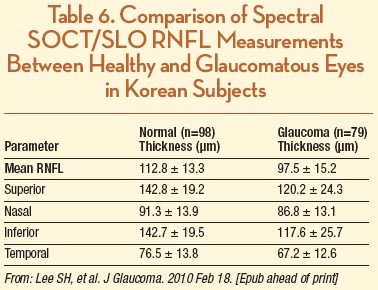
For glaucoma or optic nerve studies, the retinal nerve fiber layer OCT program used by this system acquires an average of several 3.4-mm diameter optical disc scans in order to measure the NFL thicknesses, and displays their relation to database standards. A study of Korean subjects with healthy (n = 98) and glaucomatous (n = 79) eyes reported an average RNFL thickness of 112.8 ± 13.3 and 97.5 ± 15.2 µm, respectively (Table 6). The authors also reported an excellent reproducibility of RNFL thickness measurements based on ICC values between 0.92 and 0.99.53
SOCT COPERNICUS
The SOCT Copernicus (Optopol, Zawiercie, Poland) has a 6-µm axial resolution and scans at 25,000 A-scans per second. It has a 10-mm B-scan width and allows single or customizable six-line radial scans, as well as 3D volume cube rendering. The device incorporates a retinal tracking system, and posterior segment analysis includes retinal thickness and RPE mapping, 3D cross-section animation software, NFL thickness mapping, and optic nerve head imaging. A unique aspect of the software is “RPE deformation,” which provides subretinal analysis in patients with age-related macular degeneration–associated drusen, comparable from session to session and deviation from normative data (Figure 7). Although the company has a normative database of more than 3,000 patients for macular and RNFL analysis, it is not yet available, as it is awaiting FDA approval.
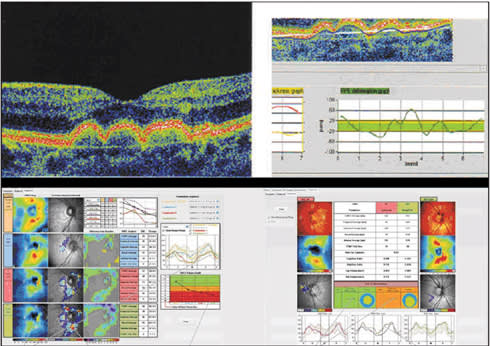
Figure 7. SOCT Copernicus HR. Top: Subretinal RPE analysis in patients with age-related macular degeneration-associated drusen is comparable from session to session and shows deviation beyond normative data (marked in green). Bottom: RNFL thickness analysis demonstrates deviation from normal, based on normative database of over 3,000 individuals, and records significant differences over time. This allows the plotting of glaucoma damage progression and staging of defects.
In a head-to-head comparison of six OCT imaging instruments (Stratus, Cirrus, Spectral OCT/SLO, Spectralis, RTVue and SOCT Copernicus) in 20 healthy subjects, average CST of SOCT Copernicus was 248 ±23 µm, which was 36 µm greater than Stratus, 29 µm less than Cirrus, 41 µm less than Spectralis, 1 µm greater than RTVue, and 4 µm greater than Spectral OCT/SLO. This variability was most likely due to differences in outer retinal boundary segmentation algorithms used by the various OCT systems; Spectralis measures from the NFL to the outermost of three hyper-reflective OCT retinal bands, which include measurement of the RPE and Bruch membrane.43 (See Figure 8 for graphical representation of the reference boundaries for each of the previously mentioned seven systems.) These data support the notion that different OCT systems cannot be used interchangeably for the measurement of macular thickness.
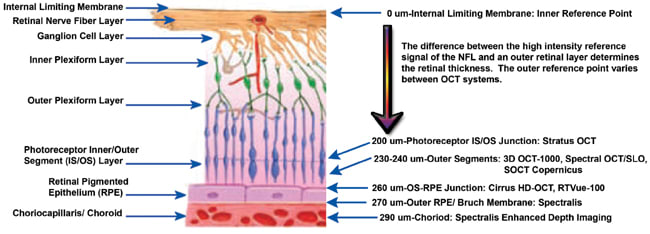
Figure 8. Graphical representation of the reference boundaries for seven different OCT systems: Stratus OCT 3000, Cirrus HD-OCT, Spectralis, 3D OCT-1000, RTVue-100, Spectral OCT/SLO and SOCT Copernicus HR. All systems' inner reference boundary is at the internal limiting membrane, but each varies in the outer reference boundary.
SD-OCT DEVICES WITHOUT CURRENTLY AVAILABLE NORMATIVE DATA: SOCT COPERNICUS HR, SDOCT AND RETINASCAN RS-3000
Launched earlier this year, the SOCT Copernicus HR (Reichert), licensed for North American use as the SPOCT (Canon/Optopol Inc, Depew, NY), employs two superluminescent diode light sources with different central wavelengths, allowing a 3-µm axial resolution at 50,000 A-scans per second in order to provide macular grid, radial line and 3D volume scans for retinal visualization, and RNFL and optic nerve head analysis. This device is still awaiting FDA approval, and no information from the company or the peer-reviewed literature is available at this time regarding normative data.
The Bioptigen SDOCT (Durham, NC) system uses high-throughput spectral interferometry to produce real-time images of ocular tissue microstructure with 4-µm axial resolution to scan at 20,000 A-scans per second. For adult and pediatric patients, up to a 10-by-10 mm retinal area of each eye can be acquired in fewer than six seconds, with oversampling along the lateral axis and no more than 80 µm spacing between B-scans. It is FDA-approved to acquire, process, display and save depth-resolved images of ocular tissue microstructure. Doppler characterization of retinal blood flow is also available.
Analysis of the ganglion cell complex, including the NFL, the ganglion cell layer, and the inner plexiform layer, is also possible with this system, although it is primarily being marketed toward use in operating room and research laboratory settings; the manufacturer's software current is still undergoing significant development and does not as yet provide any measurement quantification. At this time, no normative data are available, and macular thickness results need to be evaluated qualitatively or require manually measured analysis for quantitative information.
Nidek (Gamagori, Japan) has initiated a European launch of its SD-OCT device, which premiered at the 17th Congress of the European Society of Ophthalmology in June 2009. According to premeeting advertisement, the device features real-time SLO imaging with up to 53,000 A-scans per second taken over 1.6 seconds. One intriguing aspect of the device is the ability to provide segmentation and visualization of the retina into six distinct layers, including the ILM, NFL-ganglion cell layer, inner plexiform-inner nuclear layers, outer plexiform-outer nuclear layers, IS/OS photoreceptor layer and RPE. The company states that they will be able to provide more information about normative data to physicians after FDA approval.
CONCLUSION
The advent of spectral-domain technology has allowed extensive amounts of new anatomical, physiological and pathological data to become routinely available for the practice of ophthalmology. Although normative data are becoming available for the majority of systems, it is still pending FDA approval for a number of them. An important aspect to bear in mind is that the FDA has granted approval (or approval is pending) for use of these devices as an aid in the detection and management of ocular diseases. Although certain devices have received approval for anterior-segment imaging and measurement, currently no SD-OCT device is FDA-approved for quantification of any posterior structure or finding. Thus normative database information is technically applied and used “off-label.”
Also important to the issue of “normative” data is stratification by age, ethnicity and even gender of the subjects who make up the “normal,” since measurements in healthy individuals may vary according to these factors. Despite a recent comprehensive review of nine commercially available SD-OCT devices by our group,54 the current literature is still relatively sparse regarding availability of a wide diversity of data for SD-OCT technology. However, it is clear that large amounts of in vivo information can be acquired without invasive intervention, effectively allowing a “virtual biopsy” of the retina. In practice, clinicians and operators should remember to quantitatively and qualitatively review scans before comparing them to the macula or RNFL normative databases. RP
| Daniel F. Kiernan, MD, is a vitreoretinal fellow at the Illinois Eye and Ear Infirmary of the Department of Ophthalmology, University of Illinois-Chicago. Seenu M. Hariprasad, MD, is an associate clinical professor of ophthalmology, director of clinical research and chief of the Vitreoretinal Service at the University of Chicago. Neither author reports any financial interest in any products mentioned in this article. Dr. Hariprasad can be reached at retina@uchicago.edu. |
REFERENCES
- Drexler W, Sattmann H, Hermann B, Ko TH, Stur M, Unterhuber A, Scholda C, Findl O, Wirtitsch M, Fujimoto JG, Fercher AF. Enhanced visualization of macular pathology with the use of ultrahigh resolution optical coherence tomography. Arch Ophthalmol. 2003;121:695-706.
- Muscat S, Parks S, Kemp E, Keating D. Repeatability and reproducibility of macular thickness measurements with the Humphrey OCT system. Invest Ophthalmol Vis Sci. 2002;43:490-495.
- Patella VM. Stratus OCT: Establishment of normative reference values for retinal nerve fiber layer thickness measurements. Carl Zeiss Meditec Web site. Available at: http://www.meditec.zeiss.de/88256DE3007B916B/0/55B63359D850E15D882575E7000AA4AE/$file/stratusoct5_en.pdf. Accessed February 27, 2010.
- Eriksson U, Holmström G, Alm A, Larsson E. A population-based study of macular thickness in full-term children assessed with Stratus OCT: normative data and repeatability. Acta Ophthalmol. 2008 Sep 20. [Epub ahead of print]
- Hoh ST, Greenfield DS, Mistlberger A, Liebmann JM, Ishikawa H, Ritch R. Optical coherence tomography and scanning laser polarimetry in normal, ocular hypertensive, and glaucomatous eyes. Am J Ophthalmol. 2000;129:129-135.
- Fisher JB, Jacobs DA, Markowitz CE, et al. Relation of visual function to retinal nerve fiber layer thickness in multiple sclerosis. Ophthalmology. 2006;113:324-332.
- Ramakrishnan R, Mittal S, Ambatkar S, Kader MA. Retinal nerve fibre layer thickness measurements in normal Indian population by optical coherence tomography. Indian J Ophthalmol. 2006;54:11-15.
- Sihota R, Sony P, Gupta V, Dada T, Singh R. Diagnostic capability of optical coherence tomography in evaluating the degree of glaucomatous retinal nerve fiber damage. Invest Ophthalmol Vis Sci. 2006;47:2006-2010.
- Peng PH, Lin HS. Retinal nerve fiber layer thickness measured by optical coherence tomography in non-glaucomatous Taiwanese. J Formos Med Assoc. 2008;107:627-634.
- Manassakorn A, Chaidaroon W, Ausayakhun S, Aupapong S, Wattananikorn S. Normative database of retinal nerve fiber layer and macular retinal thickness in a Thai population. Jpn J Ophthalmol. 2008;52:450-456.
- Chan A, Duker JS, Ko TH, Fujimoto JG, Schuman JS. Normal macular thickness measurements in healthy eyes using Stratus optical coherence tomography. Arch Ophthalmol. 2006;124:193-8.
- Hee MR, Izatt JA, Swanson EA, et al. Optical coherence tomography of the human retina. Arch Ophthalmol. 1995;113:325-332.
- Sanchez-Tocino H, Alvarez-Vidal A, Maldolnado MJ, Moreno-Montañés J, García-Layana A. Retinal thickness study with optical coherence tomography in patients with diabetes. Invest Ophthalmol Vis Sci. 2002;43:1588-1594.
- Guedes V, Schuman JS, Hertzmark E, et al. Optical coherence tomography measurement of macular and nerve fiber layer thickness in normal and glaucomatous human eyes. Ophthalmology. 2003;110:177-189.
- Budenz DL, Anderson DR, Varma R, Schuman J, Cantor L, Savell J, Greenfield DS, Patella VM, Quigley HA, Tielsch J. Determinants of normal retinal nerve fiber layer thickness measured by Stratus OCT. Ophthalmology. 2007;114:1046-1052. Erratum in: Ophthalmology. 2008;115:472.
- Hong S, Kim CY, Lee WS, Seong GJ. Reproducibility of peripapillary retinal nerve fiber layer thickness with spectral domain cirrus high-definition optical coherence tomography in normal eyes. Jpn J Ophthalmol. 2010;54:43-47.
- Budenz DL, Chang RT, Huang X, Knighton RW, Tielsch JM. Reproducibility of retinal nerve fiber thickness measurements using the stratus OCT in normal and glaucomatous eyes. Invest Ophthalmol Vis Sci. 2005;46:2440-2443.
- Budenz DL, Fredette MJ, Feuer WJ, Anderson DR. Reproducibility of peripapillary retinal nerve fiber thickness measurements with stratus OCT in glaucomatous eyes. Ophthalmology. 2008;115:661-666.
- Leung CK, Cheung C Y, Lin D, Pang C P, Lam DS, Weinreb RN. Longitudinal variability of optic disc and retinal nerve fi ber layer measurements. Invest Ophthalmol Vis Sci. 2008;49:4886-4892.
- Carl Zeiss Meditec, Inc. Data on file. Carl Zeiss Meditec Web site. Available at: http://www.zeiss.de/88256DE3007B916B/0/54C80BBC43D11935882575C2 00733EEF/$file/cirrus_4_0_broschuere_en.pdf. Accessed February 27, 2010.
- Kakinoki M, Sawada S, Sawada T. Comparison of macular thickness between Cirrus HD-OCT and Stratus OCT. Ophthalmic Surg Lasers. 2008;39:37-42.
- Kiernan D F, Hariprasad SM, Chin EK, Kiernan CL, Rago J, Mieler W F. Prospective comparison of cirrus and stratus optical coherence tomography for quantifying retinal thickness. Am J Ophthalmol. 2009;147:267-275.e2.
- Forooghian F, Cukras C, Meyerle CB, Chew E Y, Wong WT. Evaluation of time domain and spectral domain optical coherence tomography in the measurement of diabetic macular edema. Invest Ophthalmol Vis Sci. 2008;49:4290-4296.
- Han IC, Jaffe GJ. Comparison of spectral- and time-domain optical coherence tomography for retinal thickness measurements in healthy and diseased eyes. Am J Ophthalmol. 2009;147:847-58, 858.e1.
- Sull AC, Vuong LN, Price LL, et al. Comparison of spectral/Fourier domain optical coherence tomography instruments for assessment of normal macular thickness. Retina. 2010;30:235-245.
- Sung KR, Kim D Y, Park SB, Kook MS. Comparison of retinal nerve fiber layer thickness measured by Cirrus HD and Stratus optical coherence tomography. Ophthalmology. 2009;116:1264-1270, 1270.e1. Epub 2009 May 8.
- Knight OJ, Chang RT, Feuer WJ, Budenz DL. Comparison of retinal nerve fiber layer measurements using time domain and spectral domain optical coherent tomography. Ophthalmology. 2009;116:1271-1277. Epub 2009 Apr 22.
- Chang RT, Knight OJ, Feuer WJ, Budenz DL. Sensitivity and specificity of time-domain versus spectral-domain optical coherence tomography in diagnosing early to moderate glaucoma. Ophthalmology. 2009;116:2294-2299.
- Marmor MF, Choi SS, Zawadzki RJ, Werner JS. Visual insignificance of the foveal pit: reassessment of foveal hypoplasia as fovea plana. Arch Ophthalmol. 2008;126:907-913.
- McAllister JT, Dubis AM, Tait DM, et al. Arrested development: High-resolution imaging of foveal morphology in albinism. Vision Res. 2010 Feb 10. [Epub ahead of print]
- Hangai M, Yamamoto M, Sakamoto A, Yoshimura N. Ultrahigh-resolution versus speckle noise-reduction in spectral-domain optical coherence tomography. Opt Express. 2009;17:4221-4235.
- Menke MN, Dabov S, Knecht P, Sturm V. Reproducibility of retinal thickness measurements in healthy subjects using spectralis optical coherence tomography. Am J Ophthalmol. 2009;147:467-472. Epub 2008 Nov 20.
- Grover S, Murthy RK, Brar VS, Chalam KV. Normative data for macular thickness by high-definition spectral-domain optical coherence tomography (spectralis). Am J Ophthalmol. 2009;148:266-271. Epub 2009 May 9.
- Grover S, Murthy RK, Brar VS, Chalam KV. Comparison of retinal thickness in normal eyes using Stratus and Spectralis Optical Coherence Tomography. Invest Ophthalmol Vis Sci. [Epub ahead of print]
- Han IC, Jaffe GJ. Comparison of spectral- and time-domain optical coherence tomography for retinal thickness measurements in healthy and diseased eyes. Am J Ophthalmol. 2009;147:847-858, 858.e1.
- Leung CK, Ye C, Weinreb RN, Cheung C Y, Qiu Q, Liu S, Xu G, Lam DS. Retinal nerve fiber layer imaging with spectral-domain optical coherence tomography a study on diagnostic agreement with Heidelberg Retinal Tomograph. Ophthalmology. 2010;117:267-274. Epub 2009 Dec 6.
- Baleanu D, Tornow R P, Horn FK, et al. Retinal nerve fiber layer thickness in normals measured by spectral domain OCT. J Glaucoma. 2009 Dec 30. [Epub ahead of print]
- Margolis R, Spaide R F. A pilot study of enhanced depth imaging optical coherence tomography of the choroid in normal eyes. Am J Ophthalmol. 2009;147:811-815. Epub 2009 Feb 20.
- Spaide RF. Enhanced depth imaging optical coherence tomography of retinal pigment epithelial detachment in age-related macular degeneration. Am J Ophthalmol. 2009;147:644-652. Epub 2009 Jan 18.
- Spaide RF. Age-related choroidal atrophy. Am J Ophthalmol. 2009;147:801-810. Epub. 2009 Feb 20.
- Garas A, Vargha P, Holló G. Reproducibility of Retinal Nerve Fiber Layer and Macular Thickness Measurement with the RTVue-100 Optical Coherence Tomograph. Ophthalmology. 2010 Jan 14. [Epub ahead of print]
- Huang J, Liu X, Wu Z, Xiao H, Dustin L, Sadda S. Macular thickness measurements in normal eyes with time-domain and Fourier-domain optical coherence tomography. Retina. 2009;29:980-987.
- Wolf-Schnurrbusch UE, Ceklic L, Brinkmann CK, et al. Macular thickness measurements in healthy eyes using six different optical coherence tomography instruments. Invest Ophthalmol Vis Sci. 2009;50:3432-3437. Epub 2009 Feb 21.
- Asefzadeh B, Cavallerano AA, Fisch BM. Racial differences in macular thickness in healthy eyes. Optom Vis Sci. 2007;84:941-945.
- Seong M, Sung KR, Choi EH, et al. Macular and peripapillary retinal nerve fiber layer measurements by spectral domain optical coherence tomography in normal-tension glaucoma. Invest Ophthalmol Vis Sci. 2010;51:1446-1452.
- González-García AO, Vizzeri G, Bowd C, Medeiros FA, Zangwill LM, Weinreb RN. Reproducibility of RTVue retinal nerve fiber layer thickness and optic disc measurements and agreement with Stratus optical coherence tomography measurements. Am J Ophthalmol. 2009;147:1067-1074, 1074.e1.
- Garas A, Tóth M, Vargha P, Holló G. Comparison of repeatability of retinal nerve fiber layer thickness measurement made using the RTVue Fourier-domain optical coherence tomograph and the GDx scanning laser polarimeter with variable or enhanced corneal compensation. J Glaucoma. 2009 Oct 22. [Epub ahead of print]
- Leung CK, Cheung C Y, Weinreb RN, et al. Comparison of macular thickness measurements between time domain and spectral domain optical coherence tomography. Invest Ophthalmol Vis Sci. 2008;49:4893-4897. Epub 2008 Apr 30.
- Ooto S, Hangai M, Sakamoto A, Tomidokoro A, Araie M, Otani T, Kishi S, Matsushita K, Maeda N, Shirakashi M, Abe H, Takeda H, Sugiyama K, Saito H, Iwase A, Yoshimura N. Three-dimensional profile of macular retinal thickness in normal Japanese eyes. Invest Ophthalmol Vis Sci. 2010;51:465-473.
- Costa-Cunha LV, Cunha L P, Malta R F, Monteiro ML. Comparison of Fourier-domain and time-domain optical coherence tomography in the detection of band atrophy of the optic nerve. Am J Ophthalmol. 2009;147:56-63.e2.
- Sabates FN, Vincent RD, Sabates NR, Gallimore G. Normative Database for Microperimetry Using the OPKO SD.OCT/SLO in Normal Subjects Implications in the Practical Management of Macular Diseases. Data on file, copyright 2010, OPKO/OTI.
- Forte R, Cennamo GL, Finelli ML, de Crecchio G. Comparison of time domain Stratus OCT and spectral domain SLO/OCT for assessment of macular thickness and volume. Eye (Lond). 2009;23:2071-2078.
- Lee SH, Kim SH, Kim TW, Park KH, Kim DM. Reproducibility of retinal nerve fiber thickness measurements using the test-retest function of Spectral OCT/SLO in normal and glaucomatous Eyes. J Glaucoma. 2010 Feb 18. [Epub ahead of print]
- Kiernan D F, Mieler WF, Hariprasad SM. Spectral-domain optical coherence tomography: a comparison of modern high-resolution retinal imaging systems. Am J Ophthalmol. 2010;149:18-31.


