Simultaneous Spectral-domain Optical Coherence Tomography and Retinal Imaging: Improvements in Retinal Examination
ANDREA GIANI, MD · MATTEO CEREDA, MD · ALESSANDRO INVERNIZZI, MD · MARCO PELLEGRINI, MD · GIOVANNI STAURENGHI, MD
Optical coherence tomography (OCT) allows noninvasive capture of cross-sectional, high-resolution images of the retina and anterior chamber.1-6 In recent years, it has improved our ability to diagnose and follow many ocular diseases, including age-related macular degeneration1,3,5,7,8 and in particular to distinguish neuroepithelial detachment and retinal epithelium detachment,2,8 macular edema,1,2,7,8 macular holes,1,2,7,8 and vitreoretinal pathologies such as epiretinal membranes, vitreomacular traction syndrome, central serous chorioretinopathy,7,8 macular distrophy,9 and glaucoma.1-3,5,7 The most common OCT systems (high resolution or ultra-high resolution) have been based on time-domain technology (TD-OCT), in which time acquisition of a single A-scan depends strictly on reference arm mirror mechanical movements for depth calculation.1,10-13
| Andrea Giani, MD, is an ophthalmologist in the Eye Clinic, Department of Clinical Science Luigi Sacco, Sacco Hospital, University of Milan and in the Department of Ophthalmology at the Harvard Medical School in Boston. Matteo Cereda, MD, practices in the Department of Ophthalmology at the Sacro Cuore Hospital of Negrar in Verona, Italy. Alessandro Invernizzi, MD, Marco Pellegrini, MD, and Giovanni Staurenghi, MD, all practice in the Eye Clinic at Sacco Hospital. Dr. Staurenghi reports minimal financial interest in Heidelberg Engineering, Carl Zeiss Meditec, and Optovue. Dr. Giana reports minimal financial interest in Zeiss. The other authors report no financial interests in any products mentioned in this article. Dr. Staurenghi may be reached via e-mail at giovanni.staurenghi@unimi.it. |
SPECTRAL-DOMAIN OCT
A potential alternative is spectral-domain OCT (SD-OCT), in which, on a single A-scan, the entire reflectance is obtained simultaneously and no depth information is needed.10 A spectrum is measured by spectrometer in the detection arm of the interferometer and converted by Fourier transformation.11-13 This difference significantly increases acquisition speed and improves resolution without compromising image quality.11 In fact, while the fastest TD-based systems reach speeds of 250 μs/A-scan acquisition,14 different SD-OCT systems reach speeds up to 34 μs/ A-scan.12 Thus, the first improvement is real 3D mapping that allows more accurate analysis without introducing software artifacts.10-14,16,17
All SD-OCT systems based on a superluminescent diode or a femtosecond titanium-sapphire laser improve axial resolution by 6 to 3 μm.11,12,14 This improved resolution allows better evaluation of microstructures, such as the photoreceptor inner and outer segment interface or the penetration site of the choroidal neovascularization through Bruch's membrane.10 Simultaneous execution of different types of exams can improve clinical analysis, leading to direct examination and better evaluation of areas of greatest clinical interest and resulting in easier interpretation.18,19
We retrospectively analyzed data from examinations on outpatients (each patient gave informed written consent before the OCT and retinal imaging examination) receiving care at the Department of Clinical Science, Luigi Sacco Hospital, University of Milan, in order to evaluate advantages given by the possibility of simultaneously executing SD-OCT and retinal imaging examination compared to traditional TD-OCT. From our analysis, we selected some cases that better represent our findings.
All the analyzed patients underwent OCT examination using both TD-OCT Stratus from Carl Zeiss Meditec and Spectralis HRA+OCT (Heidelberg Engineering). With Stratus it performed the Macular Thickness Map acquisition protocol, and images were analyzed after "normalized" elaboration. Images were analyzed in grayscale to enhance visualization of fine elements.
During examination with Spectralis, the operator could view the OCT and retinal images at the same time and he could position the OCT scanning line by moving it to interesting areas visualized in SLO images (SLO images could be either infrared reflectance image, red-free image, fluorescein or indocyanine green angiography [ICGA] image, or a fundus autofluorescence image).
CASE REPORTS
Patient A
A 52-year-old man with a 2-year history of type 2 diabetes mellitus, without diabetic retinopathy and normal visual acuity (VA), was routinely analyzed with TD-OCT and SD-OCT. Best-corrected VA was 20/20. As visible in Figure 1, SD-OCT improves the visualization of retinal layers, such as the nerve fibers layer, ganglion cells layer, internal plexiform layer, inner nuclear layer, outer plexiform layer, and outer nuclear layer. In particular, comparing SD-OCT (top panel) and TD-OCT (bottom panel) images, the higher contrast between hyperreflective and hyporeflective layers is evident. In SD-OCT, at the inner limit of the retina, adhesion of vitreous in some areas appears more reflective, probably due to a more square reflection surface that increases light reflected from this layer. With Spectralis, the external limiting membrane is visible and photoreceptors inner/outer segment interface is evident for all the length of the retinal scan line. In TD-OCT imaging, these elements are not clearly distinguishable; in particular, the external limiting membrane generates a very weak interferometric signal. In the inset (Figure 1a), we present an SD-OCT image of multiple subfoveal retinal pigmented epithelium (RPE) detachments to better visualize Bruch's membrane, which is not distinguishable from the RPE layer in normal retinas.
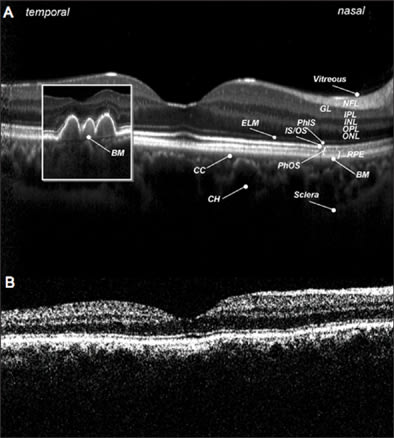
Figure 1. A normal retina, analyzed with spectral-domain OCT (top panel) and time-domain OCT (bottom panel). Figure 1a. (Small inset in SD-OCT image) multiple subfoveal RPE detachments to show Bruch's membrane (BM).
NFL: nerve fibers layer; GL: ganglion cells layer; IPL: inner plexus layer; INL: inner nuclear layer; OPL: outer plexus layer; ONL: outer nuclear layer; ELM: external limiting membrane; PhIS: photoreceptor inner segment; IS/OS: photoreceptor inner/outer segment interface, RPE: retinal pigment epithelium; CC: choriocapillaris; CH: choroid
Patient B
A 68-year-old man with a 3-year history of exudative age-related maculopathy had been treated with photodynamic therapy in his right eye 2 years before and recently presented reactivation of the lesion. Best-corrected VA was 20/63. In Figure 2, we can see the subfoveal CNV analyzed with simultaneous SD-OCT and ICGA. The line along the ICGA images represents the exact location of the OCT scan line. In SD-OCT images, the vascular net organization is visible, and under neovascularization, Bruch's membrane (arrow head) is easy to identify as a continuous, hyperreflective band, separating from the RPE layer.
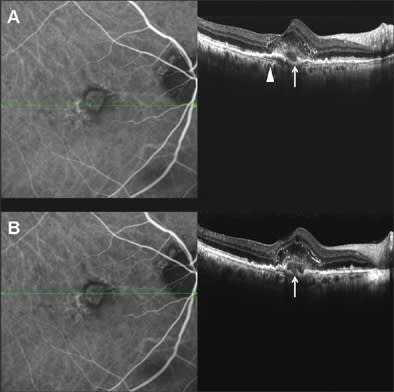
Figure 2. Subfoveal choroidal neovascularization, analyzed with SD-OCT and simultaneous ICGA. Internal structure of the CNV and photoreceptor alteration are visible in SD-OCT images. BM is definite and continuous as a hyperreflective band separating from RPE (arrow head). Choroidal vessels are sharp and identifiable. Very little translation of scanning position between top panel and bottom panel reveals the presence of RPE disruption (white arrow).
A very little shift of scan line position between the top panel and bottom panels allows us to identify a disruption on the RPE layer (white arrow), not visible in the top panel and clearly distinguishable in the bottom panel. This is probably the point of penetration of new vessels from choroidal to retinal space. Even intraretinal elements are well visible: The external limiting membrane is a continuous, hyperreflective, thin band that follows the shape of the underlying alterations. Moreover, photoreceptors over the CNV appear altered, as a hetereogeneous, thickened layer under the inner limiting membrane.
Patient C
A 69-year-old woman had an 8-year history of dry age-related maculopathy in both eyes. Best-corrected VA in her left eye was 20/63. In Figure 3, we present images of simultaneous acquisition of AF and SD-OCT. The SD-OCT images make clear the difference in retinal layers between normal retina and atrophy. Two kinds of atrophic areas are distinguishable: the bigger one in which both photoreceptors and RPE layers are lacking; and the smaller one with an evident alteration of photoreceptors and RPE cells that are clearly dystrophic but still present.
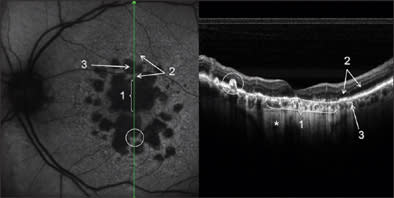
Figure 3. Confluent and multiple retinal atrophic areas simultaneously examined by AF and SD-OCT (left eye). In the AF image, there is absence of autofluorescence in correspondence to RPE atrophy, due to the lack of lipofuscin. In the SD-OCT image, subretinal structures under atrophy are more visible for higher passage of reflectance, and it is possible to visualize the sclera (*). Note the differences in the RPE and photoreceptors layers between the normal retina (2) and atrophy areas (1 and 3). In the white circle, a hypertrophic RPE area can be seen.
In both cases, atrophy of the retina, as identified on OCT, explains the better visualization of subretinal structures. In particular, choroidal vessels are evident and their limits are sharper than under normal retina areas; even sclera could be visualized under choroidal vessels. Note that, along the scan line, there is an area of hypertrophic RPE area corresponding in retinal imaging to 1 of the residual autofluorescent zones surrounded by atrophy. In Figure 4, a comparison is shown between SD-OCT (top panel) and TD-OCT (bottom panel) images of the right eye. Best-corrected VA in this eye was 20/32 because of a relatively conserved neuroretina in the foveal region. The retina is diffusely thinned so that choroid and choriocapillaris are visible. Note the high backscattering (*) in correspondence of an atrophy area: In SD-OCT imaging, choroidal vessels are more distinguishable than in TD-OCT images.
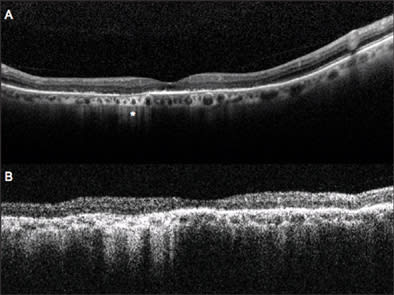
Figure 4. Dry AMD analyzed with SD-OCT (top panel) and TD-OCT (bottom panel). General thinning of retina explains the good visualization of choroid. Note the area of atrophy with high backscattering (*). Analysis of RPE condition in this area is only possible using SD-OCT, while TD-OCT does not permit distinguishing this layer from the choriocapillaris and choroid.
Patient D
A 52-year-old woman had a choroidal nevus below a complete macular hole with pseudocystic degeneration in the adjacent retina in her left eye. Best-corrected VA was 20/200. In Figure 5 images are presented of Spectralis examination. In SD-OCT images, the nevus is visible under the RPE layer: Its limits are distinguishable and well defined. Internal structure is appreciable and some internal vessels are at least intuitable. No liquid accumulation near the lesion is visible; that is a sign of benignity. Our simultaneous acquisition of an autofluorescence image shows the typical features of a macular hole (top panel), with visualization of RPE autofluorescence for the lack of foveal retina and macular pigment. The simultaneous retinal image is infrared, allowing easy recognition of the choroidal nevus because of better tissue penetration at this wavelength. The hole appears as a central white disk because of high reflectivity of naked RPE. In the bottom panel, TD-OCT image permits us to distinguish the nevus, but very little information on its limit and internal structure is provided.
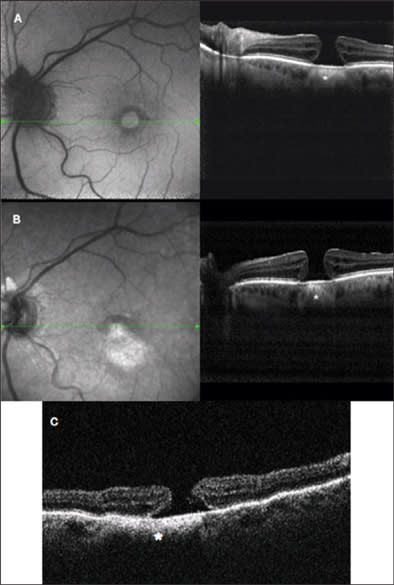
Figure 5. Complete macular hole with choroidal nevus. In the top panel, we see simultaneous visualization of SD-OCT and autofluorescence; in AF, the hyperautofluorescent central area corresponds to the lack of neuroretina with higher passage of autofluorescence from the RPE. In the SD-OCT image, note the hyperreflective structure under foveal RPE, corresponding to the choroidal nevus (*), with very sharp and definite boundaries. In the midpanel are presented simultaneous acquisition of IR and SD-OCT; in retinal imaging, the shape of nevus is evident, with the higher penetration of IR wavelength beneath the retina appearing as a hyperreflective lesion. In SD-OCT, the nevus is visible (*), with some information about its internal structure. In the bottom panel is the TD-OCT examination: the nevus is still distinguishable, but its boundaries are not clear and no information on internal structure is provided.
DISCUSSION
This series of cases clearly shows the advantages given by the possibility of simultaneously taking different types of images, such as OCT and FA or indocyanine angiography. This could improve our ability to diagnose retinal and subretinal lesions.
With such improvements, OCT imaging could focus on the most clinically relevant points for better localization and discrimination of hyper- and hypofluorescent zones. For example, directing the OCT scan line to the point of leakage could give a better understanding of its origin, giving tomographic information and permitting us to accurately identify exact depth location of different lesions.
The second aspect to remark is that images obtained using SD-OCT show high definition in retinal-layer visualization, easily discriminating interfaces between different reflectance structures. The comparison with TD-OCT images on normal and pathological retinas shows that the increased resolution and the reduction of signal noise can lead to better visualization of fine structures. For example, the RPE layer appeared as 2 distinct hyperreflective bands. This finding has been reported in studies using ultra-high-resolution OCT systems.8,10,11,16 They differ from results using normal high-resolution TD-OCT images in which the RPE layer appears as a unique hyperreflective band. The outer band should correspond to RPE cells, but the origin of the inner band remains unclear. Many studies suggest that this band corresponds to Verhoeff's membrane,16 constituted by tight junctions of RPE cells;20 another hypothesis is that it corresponds to basal infoldings and apical processes that enclose photoreceptor outer segments.
An important advantage in having the OCT window close to the live retinal image is the possibility for the operator to position the OCT scanning line by moving it to interesting areas visualized in SLO images, even thanks to the "ART" function: This Heidelberg feature is, in fact, able to create a real-time average of the images, thus decreasing noise and sharpening visualization, in particular of structures under the RPE.
Moreover, the software allows the viewer to set a scan as a reference. In the following visits, the eye-tracking system will be able to perform the OCT scans in the exact position of the previous examination, recognizing some "key" points on the retinal surface and thus making the follow-up analysis more efficient (Figure 6).
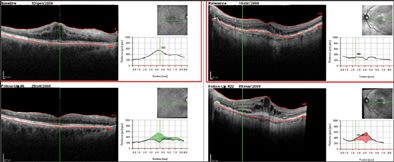
Figure 6. Two follow-up samples: In the left panel, cystoid macula edema disappearing in following visits (the software shows a green area corresponding to the reduced thickness). In the right panel, two consequence examinations of a CNV lesion with increasing edema and developing of subretinal fluid (the red area represents the increased retinal thickness). The green arrow on the SLO image corresponds with the exact scan line.
In conclusion, this new generation of SD-OCTs can improve our accuracy in retinal and choroidal examination. This is possible by enhancing image quality through higher axial resolution and a real-time mean image system, as well as by taking simultaneous retinal images and consequently directing the SD-OCT scan line to the most clinically interesting points. This ability to focus on areas of clinical interest allows integration of tomographic information with the normal SLO examination, leading to an easier and more accurate diagnosis and follow-up. RP
REFERENCES
- Swanson EA, Izatt JA, Hee MR, et al. In-vivo retinal imaging by optical coherence tomography. Opt Lett. 1993;18:1864-1866.
- Puliafito CA, Hee MR, Lin CP, et al. Imaging of macular diseases with optical coherence tomography. Ophthalmology. 1995;102:217-229.
- Hee MR, Izatt JA, Swanson EA, et al. Optical coherence tomography of the human retina. Arch Ophthalmol. 1995;113:325-332.
- Fujimoto JG, Brezinski ME, Tearney GJ, et al. Optical biopsy and imaging using optical coherence tomography. Nat Med. 1995;1:970-972.
- Huang D, Swanson EA, Lin CP, et al. Optical coherence tomography. Science. 1991;254:1178-1181.
- Dawczynski J, Koenigsdoerffer E, Augsten R, Strobel J. Anterior optical coherence tomography: a non-contact technique for anterior chamber evaluation. Graefes Arch Clin Exp Ophthalmol. 2007;245:423-425.
- Thomas D, Duguid G. Optical coherence tomography—a review of the principles and contemporary uses in retinal investigation. Eye. 2004;18:561-570.
- Drexler W, Sattmann H, Hermann B, et al. Enhanced visualization of macular pathology with the use of ultrahigh-resolution optical coherence tomography. Arch Ophthalmol. 2003;121:695-706.
- Wirtitsch MG, Ergun E, Hermann B, et al. Ultrahigh resolution optical coherence tomography in macular dystrophy. Am J Ophthalmol. 2005;140:976-983.
- Schmidt-Erfurth U, Leitgeb RA, Michels S, et al. Three-dimensional ultrahigh-resolution optical coherence tomography of macular diseases. Invest Ophthalmol Vis Sci. 2005;46:3393-3402.
- Chen TC, Cense B, Pierce MC, et al. Spectral domain optical coherence tomography: ultra-high speed, ultra-high resolution ophthalmic imaging. Arch Ophthalmol. 2005;123:1715-1720.
- Nassif N, Cense B, Park B, et al. In vivo high-resolution video-rate spectral-domain optical coherence tomography of the human retina and optic nerve. Opt Express. 2004;12:367-376.
- Wojtkowski M, Bajraszewski T, Targowski P, Kowalczyk A. Real-time in vivo imaging by high-speed spectral optical coherence tomography. Opt Lett. 2003;28:1745-1747.
- Wojtkowski M, Bajraszewski T, Gorczynska I, et al. Ophthalmic imaging by spectral optical coherence tomography. Am J Ophthalmol. 2004;138:412-419.
- Yun SHT, G.J., Bouma, B.E., Park, B.H., de Boer, J.F. High-speed spectral-domain optical coherence tomography at 1.3 μm wavelength. Opt Express. 2003;11:3598-3604.
- Alam S, Zawadzki RJ, Choi S, et al. Clinical application of rapid serial fourier-domain optical coherence tomography for macular imaging. Ophthalmology. 2006;113:1425-1431.
- Wojtkowski M, Leitgeb R, Kowalczyk A, Bajraszewski T, Fercher AF. In vivo human retinal imaging by Fourier domain optical coherence tomography. J Biomed Opt. 2002;7:457-463.
- Freeman WR, Bartsch DU, Mueller AJ, Banker AS, Weinreb RN. Simultaneous indocyanine green and fluorescein angiography using a confocal scanning laser ophthalmoscope. Arch Ophthalmol. 1998;116:455-463.
- Holz FG, Bellmann C, Rohrschneider K, Burk RO, Volcker HE. Simultaneous confocal scanning laser fluorescein and indocyanine green angiography. Am J Ophthalmol. 1998;125:227-236.
- Hollenberg MJ, Spira AW. Human retinal development: ultrastructure of the outer retina. Am J Anat. 1973;137:357-385.


