PHOTO ESSAY
Retinal Blood-flow Velocity and Oximetry Status Monitoring in a Central Retinal Vein Occlusion Patient
TEERAPAT JITTPOONKUSON, MD · PATRICIA M.T. GARCIA, MD · GENNADY LANDA, MD · RICHARD B. ROSEN, MD
Patients who develop central retinal vein occlusion (CRVO) are typically older and commonly suffer from systemic hypertension, cardiovascular disease, diabetes mellitus, and/or glaucoma.1 Fluorescein angiography (FA) is the gold standard diagnostic exam for characterization and follow-up of this condition. However, FA provides mostly qualitative data, dynamic imaging, and recognizable patterns without the ability to characterize quantitative parameters such as retinal blood flow velocities or mapping of oxygen perfusion changes which occur during the course of the disease. The Retinal Function Imager (RFI)2 (Optical Imaging Ltd., Rehovot, Israel) is a new diagnostic imaging system which records and analyzes blood-flow velocity and oximetry perfusion patterns without the need for dye injection. In this report, we will demonstrate how these capabilities can be used to monitor in a patient with central retinal vein occlusion.
| Teerapat Jittpoonkuson, MD, is chief of the Retina Service in the Department of Ophthalmology at the Bangkok Metropolitan Administration General Hospital in Thailand. Patricia M.T. Garcia, MD, is a research associate in the Advanced Retinal Imaging Center of the New York Eye and Ear Infirmary (NYEEI) and assistant professor of ophthalmology at the New York Medical College (NYMC). Gennady Landa, MD, is a retina research fellow at the Advanced Retinal Imaging Center of the New York Eye and Ear Infirmary and assistant professor of ophthalmology at NYMC. Richard B. Rosen, MD, FACS, FASRS, CRA, is vice chair, surgeon director, and directory of ophthalmology research at NYEEI and professor of ophthalmology at NYMC. Dr. Garcia reports a moderate financial interest in OPKO-OTI, and Dr. Rosen reports minimal financial interests in Clarity and Optical Imaging and significant financial interest in OPKO-OTI. Drs. Landa and Jittpoonkuson report no financial interests. Dr. Jittpoonkuson may be reached via e-mail at dr.teerapat@yahoo.com. |
METHODS
Retinal functional parameters that included segmental retinal blood flow velocity, average retinal blood flow velocity and oximetry were obtained using the Retinal Function Imager, along with standard fluorescein angiography. Both Retinal Function Imager and fluorescein angiograph tests were performed on the same day at the first visit and at the 5-month follow-up visit. Areas of capillary non-perfusion on the FA images were overlaid and compared to oximetry maps. Regions of interest on the images from serial visits were compared for the changes in the retinal blood-flow velocity.
RESULTS
This case report documents the progress of a 48-year-old African-American man who presented with a 2-week history of sudden visual loss in his left eye. The patient did not have history of glaucoma, diabetes mellitus, cardiovascular disease, or systemic hypertension. There was no smoking or alcoholic consumption in his past history.
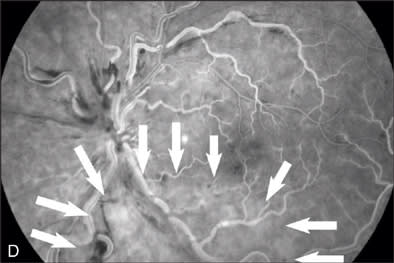
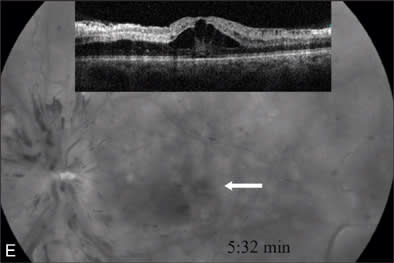
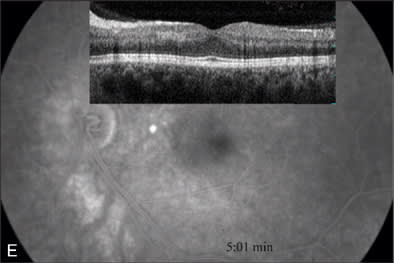
At our initial examination in August 2008, corrected visual acuity was 20/30 in the right eye and 20/50 in the left, with normal ocular pressure in both eyes. There were no rubeosis irides in either eye. Fundus examination appeared normal in the right eye while the left eye revealed a typical nonischemic CRVO (Figure 1A). Fluorescein angiography of the left eye (Figure 1B to 1E) showed generalized dilated, tortuous retinal veins, intraretinal hemorrhages, peripheral retinal non-perfusion areas, and microvascular leakage at the macula (Figure 1E, arrow). Despite the peripheral retinal ischemia, the macula itself was not ischemic at the first visit, as evidenced by the early phase FA showing 2 cilioretinal arteries supplying the fovea (Figure 1C, arrow). Spectral domain OCT (OPKO-OTI, Miami, FL.) confirmed the diagnosis of cystoid macular edema (CME). The patient got intravitreal bevacizumab (Avastin) injection (1.25 mg/0.05 mL) at the first visit.

|

|

|
|
|

|

|
Figure 1 A–G |
Oximetry Analysis
Oximetry (Figure 1F) revealed multiple color alterations. In a normal eye (data not shown), the arterial oximetry appears red, venous oximetry appears blue. In this case, it appeared that the arterial oximetry appeared blue (red arrow) and the venous oximetry appeared in green (yellow arrow). An area of nerve fiber layer infarction (black arrow), corresponding to the red-free photo finding (Figure 1B) appeared white on the oximetry map (Figure 1F). The area of non-perfusion as indicated on FA (Figure 1D, arrow outlined) appeared deep blue on the oximetry map (Figure 1F).
|
|

|

|
|

|
|
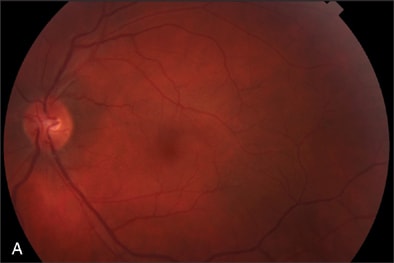
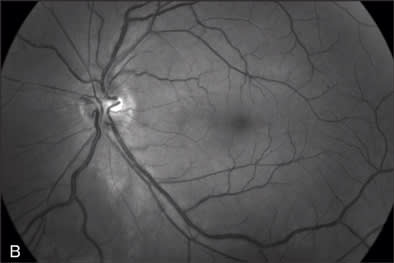
Figure 2 A–G |
Blood-flow Analysis
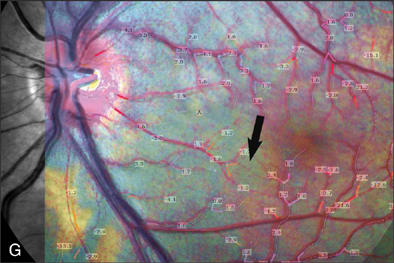
We studied the correlation between the oximetry appearance and the blood-flow velocity values in each area by overlaying the segmental blood-flow velocity maps onto the oximetry images using Adobe Photoshop software to align the vascular patterns (Figure 1G). The blue regions of the oximetry maps demonstrated lower blood-flow velocities than the red regions on the same maps. In Figure 1G, the average blood-flow velocity values for the entire retina were 1.11 and 1.00 mm/sec for artery and vein respectively. (In normal eyes, the average blood-flow velocity values for artery and vein are 4.6±0.6 and 3.8±0.5 mm/sec respectively).3
The patient was examined every 6 weeks and the clinical findings improved gradually. The intravitreal Avastin injection was repeated at the second visit.
At the 5-month follow-up visit in February 2009, corrected visual acuity remained 20/20 in the left eye, with normal ocular pressure in both eyes. There were no rubeosis irides in either eye. Fundus examination appeared normal in the right eye with improvement in the appearance of the retinal vasculature in the left (Figure 2A). Fluorescein angiography of the left eye (Figure 2B to 2E) showed resolution of the CRVO characteristics (dilated, tortuous retinal veins, intraretinal hemorrhages, peripheral retinal non-perfusion areas) with no microvascular leakage at the macula. Spectral OCT confirmed no cystoid macular edema (Figure 2E).
The RFI reports of the 2 visits were compared as the following.
Oximetry Analysis
Figure 1F demonstrates the changes of oximetry between the 2 visits. The arterial oximetry changed from blue to red (red arrow), the venous oximetry changed from green to blue (yellow arrow). The non-perfusion area in the Figure 1F (appeared in blue) disappeared as shown in the follow-up visit report (Figure 2F), this was well correlated with the changes in the FA images in Figures 1D and 2D. The change to the nerve fiber layer infarction area was also observed on the oximetry, where it primarily appeared in white (Figure 1F, black arrow) then it disappeared in the follow-up visit report (Figure 2F), this change was also well correlated with the change between the red-free images (Figure 1B, arrow outlined, and Figure 2B).
Blood-flow Analysis
The segmental blood-flow reports (Figures 1G and 2G) were also compared and described in the details of changes. In the area in the Figure 1G (white arrow outlined) that appeared to be poorly perfused, blood-flow velocities were depressed compared to results of the same area in the follow-up visit report (Figure 2G). The segmental blood-flow value under the nerve fiber layer infarction area (Figure 1G, black arrow) had no significant change between the 2 visits. The average blood-flow values of the entire retina at the follow-up visit were 3.03 and 2.08 mm/sec for artery and vein respectively, compared with the values at the first visit of 1.11 and 1.00 mm/sec for arteries and veins respectively.
DISCUSSION
In this case, the visual acuity in the left eye recovered from 20/50 to 20/20 at the 5-month follow-up visit. CME was the main cause of visual deterioration at the onset of this case. The nonischemic CRVO patient typically has a good visual prognosis. In most cases, the visual acuity resumes after a resolution of the CME. The improvement in CME may be attributed to the natural history and/or the Avastin injection.4
The Retinal Function Imager was able to detect and describe oximetry in the area of reduced perfusion and nerve fiber layer infarction as well as provide quantitative retinal blood-flow velocity values in the areas of interest. It was also able to monitor the changes in oximetry and retinal blood-flow values over time. There appeared to be good correspondence between the non-perfusion area in FA and the blue areas in the oximetry image. Also, the disappearance of the blue areas correlated well with the reperfusion of the corresponding areas in FA. However, there are some colors in the oximetry images that are not well understood in terms of their correlation with FA perfusion. Retinal blood-flow velocities correlated well with the FA imaging and demonstrated improvement corresponding to the clinical and FA course. The noninvasive nature of the RFI exam is a distinct advantage for frequent follow examinations and may prove a useful adjunct to FA. Currently, a multicenter study is being planned to determine the useful applications of this instrument in following patients with retinal vascular diseases. RP
REFERENCES
- Srivasta SK, Fekrat S. Venous obstructive disease. In: Huang D, Kaiser PK, Lowder CY, Traboulsi EI, eds. Retinal Imaging. New York, NY: Elsevier; 2006;248-260.
- Nelson DA, Krupsky S, Pollack A, et al. Special Report: Special report: Noninvasive multi-parameter functional optical imaging of the eye. Ophthalmic Surg Laser Imaging. 2005;36:57-66.
- Jangi AA, Landa G, Rosen R, Walsh J, Garcia P. Retinal blood flow velocity in normal subjects using the retinal function imager. Poster presented at: ARVO Annual Meeting; April 27-May 1, 2008; Ft. Lauderdale, FL.
- Iturralde D, Spaide RF, Meyerle CB, et al. Intravitreal Bevacizumab (Avastin) treatment of macular edema in central retinal vein occlusion: a short term study. Retina. 2006;26:279-284.


