PEER REVIEWED
Fundus Autofluorescence and Disease Markers in Dry AMD
STEFFEN SCHMITZ-VALCKENBERG, MD · FRANK G. HOLZ, MD
Despite the recent breakthrough with anti-vascular endothelial growth factor (VEGF) therapy for its neovascular phenotype, age-related macular degeneration (AMD) as the most common cause of legal blindness in industrialized countries remains an incompletely understood, complex retinal disease.1-8 Prophylactic and therapeutic options are still limited. Therefore, a better understanding of the underlying pathogenetic mechanisms of AMD appears mandatory. Furthermore, sensitive diagnostic tools and prognostic markers to evaluate disease stage and progression in the individual patient are needed.
It is thought that the retinal pigment epithelium (RPE) plays a key role in the disease process both in early and late variants of AMD.1,9,10 Excessive accumulation of lipofuscin granules in the lysosomal compartment of RPE cells represents a common downstream pathogenetic pathway in various retinal diseases including AMD.11-18 Lipofuscin is derived from the chemically modified residues of incompletely digested photoreceptor outer segment discs. Recent experimental findings suggest that certain molecular compounds of lipofuscin, such as A2-E (N-retinylidene-Nretinylethanolamin), possess toxic properties and may interfere with normal cell function via various molecular mechanisms.19-24
Detection of lipofuscin is facilitated by its autofluorescent properties. When stimulated with light in the blue range, lipofuscin granules emit a characteristic yellow fluorescence.25,26 The distribution of lipofuscin in postmitotic human RPE cells and the accumulation of lipofuscin with age have been extensively studied in vitro with fluorescence microscopic techniques.11,13,16
| Steffen Schmitz-Valckenberg, MD, is research fellow in the Department of Ophthalmology at the University of Bonn in Germany. Frank G. Holz, MD, is professor and chair of ophthalmology at the University of Bonn. Dr. Holz has been a consultant to Heidelberg Engineering; Dr. Schmitz-Valckenberg has no financial interests in any product or technology mentioned in this article. Dr. Schmitz-Valckenberg can be reached via e-mail at steffen.schmitz-valckenberg@ukb.uni-bonn.de. |
FUNDUS AUTOFLUORESCENCE IMAGING
Fundus autofluorescence (FAF) imaging allows for visualization of the topographic distribution of lipofuscin over large retinal areas and, therefore, mapping of metabolic changes at the level of the RPE cell monolayer. Spectrophotometric measurements by Delori and colleagues27 have demonstrated that the FAF signal detected in vivo mainly originates from RPE lipofuscin fluorophores. The clinician should be aware that additional fluorophores that may be generated in association with diseases in the outer retina and the subneurosensory space may contribute to the detected FAF signal.
The autofluorescence intensity of fundus is about 2 orders of magnitude lower than the background of a fluorescein angiogram at the most intense part of the dye transit. Further difficulties in detecting FAF result from absorption of the excitation light by and autofluorescence properties of anatomic structures anterior to the retina, including optical media and in particular the crystalline lens. As a result, adjustments and modifications of existing camera systems or new imaging devices are required to record FAF. Confocal scanning laser ophthalmoscopy (cSLO) addresses the limitations of low intensity of the FAF signal and the interference of the crystalline lens. It was used initially by von Rückmann et al.28 in a clinical FAF imaging system in 1995. Modern cSLO systems allow for recording of high-contrast FAF imaging in a non-timeconsuming manner and at low exposure levels that are well below the maximum retinal irradiance limits of lasers established by the American National Standards Institute and other international standards (ANSI Z136.1; 1993).29
While the confocal optics of the cSLO ensure that light originating in the light beam, but out of the focal plane, is greatly suppressed to a large degree, the flash light of the fundus camera illuminates the entire posterior pole at the same time, and the fluorescence signal reaching the photodiode derives from all tissue levels in the light beam with fluorescent properties. Furthermore, the fundus camera is theoretically more prone to light scattering anterior and posterior to the plane of interest, which can also influence the detected signal. Using similar wavelengths in the blue range, as for the cSLO (488 nm), the lens significantly contributes to the FAF signal, particularly in older patients with yellowing of the lens and nuclear opacities. The elegant idea that was brought forward by Spaide in 200330 is to limit the influence of lens by moving the excitation and emission wavelengths for FAF imaging more toward the red end of the spectrum. FAF images produced by cSLO and fundus camera systems appear to be grossly similar. However, current knowledge suggests that lipofuscin is composed of several fluorophores with different spectral characteristics.31,32 Although FAF encompasses a wide excitation and emission range, the use of longer wavelength with the fundus camera compared to the cSLO would theoretically result in the detection of autofluorescence from a somewhat dissimilar complement of fluorophores. For example, macular pigment absorption in the central retina occurs to a much lesser extent with the fundus camera (Figure 1). With regard to FAF findings in AMD, it should be noted that a systematic comparison between both imaging systems for specific retinal pathologies is still lacking.
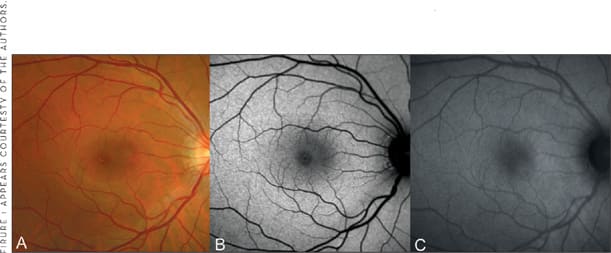
Figure 1. FAF imaging in normal subject A. Fundus photograph B. Mean and normalized FAF image recorded with the cSLO (Heidelberg Retina Angiograph, HRA 2, Heidelberg Engineering, Germany) C. FAF image obtained with the modified fundus camera (TRC-50IX, Topcon, Paramus, NJ). The FAF signal of the optic nerve head (absence of autofluorescent material) and of retinal blood vessels (absorption phenomena by blood contents) is decreased. Note the different distribution of intensity in the fovea between cSLO and fundus camera imaging. This most likely due to different degrees of absorption of the excitation light by macular pigment.
INTERPRETATION OF FAF IMAGES
The FAF image shows the spatial distribution of the intensity of the signal for each pixel in gray values (arbitrary values from 0 to 255). Low pixel values (dark) illustrate low intensities and high pixel values (bright) illustrate high intensities. Retinal blood vessels (absorption by blood) and the optic nerve head (absence of the RPE-related fluorophores) exhibit a very low FAF signal. The FAF intensity increases with age and is highest at the posterior pole (between 5° and 15° from the fovea).27 The dip of the signal in fovea is explained by absorption of macular pigment (ie, lutein and zeaxanthin in the neurosensory retina) and increased melanin content and lower density of lipofuscin granules centrally located RPE cells.
As with any imaging method, the quality of FAF images is of utmost importance to gain optimal information from these recordings.33 Poor image quality may give rise to misinterpretation or may even render FAF image interpretation impossible. The use of a standardized protocol and the consideration of some basic principles can significantly improve quality and facilitate analysis of FAF images. Both the technicians obtaining the images and the physician interpreting the findings should be familiar with the cSLO technique and FAF recording. Pitfalls may occur during the processing of single images to a mean image and by the normalization of the pixel histogram, which is usually performed by commercially available software packages. If in doubt about artifacts or unusual findings, the FAF movie and corresponding reflectance images obtained with the same wavelength should be reviewed to exclude inaccurate orientation of the camera, false detector or focus sensitivity settings, blockage of excitation light (ie, by vitreous floaters or cataracts), or pseudofluorescence. For the evaluation and interpretation of an FAF image in an individual patient, it is also essential to correlate the findings with funduscopy and — if available — those obtained with other imaging methods such as optical coherence tomography and fluorescein angiography.
FAF IMAGING AND DISEASE MARKERS IN EARLY AMD
Drusen visible on fundus photography are not necessarily correlated with notable FAF changes and areas of increased FAF may or may not correspond with areas of hyperpigmentation or soft or hard drusen.28,30,34-40 A large variability of FAF findings patients with early AMD has been reported by an international workshop on FAF phenotyping in early AMD.41 A classification system with 8 different FAF patterns was developed based on numerous collected phenotypes. Until now, it has not been tested in a longitudinal fashion to determine whether this classification system is useful to identify specific high-risk characteristics for disease progression or may be used for molecular genetic analysis to identify 1 or several genes conferring risk for the development of certain AMD manifestations.
The data on FAF imaging with regard to the identification of prognostic determinants and risk for developing late-stage AMD is limited. Particularly, natural history studies with long observation periods and large patient cohorts are lacking. Some evidence on the impact of FAF abnormalities in early AMD with respect to AMD progression has been obtained by cross-sectional analysis in patients with early AMD in 1 eye and late-stage AMD in the fellow eye. However, the results are partly inconclusive. The study by Smith and colleagues40 reported that patients with unilateral exudative AMD tended not to exhibit FAF abnormalities in the fellow eye with early AMD manifestation. The analysis by Spaide30 showed that patients with unilateral exudative AMD had larger amounts of areas with abnormal autofluorescence in the fellow eye with early AMD compared to patients with early AMD and without a history of exudative AMD in both eyes. It may be important that the imaging devices, the design, and the image analysis were different between these studies, which may be (partly) responsible for the discrepancy between the results. As part of their cross-sectional study on FAF findings in exudative AMD, McBain et al.42 mentioned 4 eyes that had FAF images taken prior to the study and before the development of choroidal neovascularization (CNV). In none of the eyes was there any increased FAF at the site or in the vicinity where the CNV later developed. This would suggest that excessive accumulation of lipofuscin may not, at least locally, play an essential role in CNV formation.
Longitudinal data on a larger patient population with soft drusen were published by Einbock and colleagues.43 During the mean 18-month follow-up period, severe visual loss occurred in 11 of 125 patients. Two eyes developed geographic atrophy (GA) and were classified as having "focal" FAF pattern and the "focal–plaque-like" pattern at baseline. The latter eye probably represents the development of GA following the collapse and flattening of large drusenoid RPE detachments, which may predispose to GA.44,45 The remaining 9 eyes with loss of >6 Early Treatment of Diabetic Retinopathy (ETDRS) lines were found to have exudative AMD with the so-called patchy FAF pattern being the most frequent baseline pattern (Figure 2). A total of 35 eyes were classified to exhibit this pattern at baseline, 6 of which developed exudative AMD over the review period. This finding strongly suggests that the patchy FAF pattern in early AMD may indeed represent a high-risk marker for progression to advanced AMD.
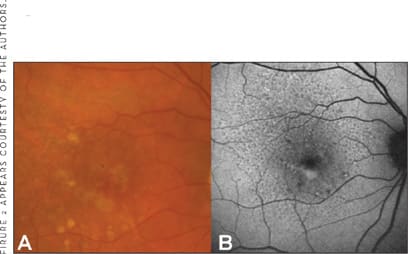
Figure 2. FAF imaging in early AMD A. Fundus photograph of the left eye shows early AMD with pigment abnormalities and multiple drusen. B. The corresponding FAF images reveals level of increased intensity below the foveal correlating with funduscopically visible soft drusen. This "patchy" pattern may represent a high-risk marker for progression to advanced AMD. Note also the presence of reticular drusen, visible as a prominent mosaic pattern over the whole posterior pole with multiple roundish spots with decreased intensities. A similar pattern with deep orange-yellowish spots but less evident is seen on the fundus photograph.
FAF IMAGING AND DISEASE MARKERS IN GEOGRAPHIC ATROPHY
Geographic atrophy as the atrophic late-stage manifestation of "dry" AMD represents a dynamic disease process. During the natural course of the disease, atrophy slowly enlarges over time, the fovea itself may be involved, and patients experience increasing loss of visual function.46-48 There is high variability in atrophy enlargement over time between patients that cannot be explained, either by the baseline atrophy or any other demographic factor tested so far.49-51
Fundus autofluorescence findings in GA are inconsistent with histopathological reports. Atrophic patches are characterized by a very low intensity due to atrophy of the RPE (including absence of lipofuscin granules). In the junctional zone between atrophic and normal retina, levels of increased FAF intensity may occur due to excessive accumulation of lipofuscin and melanolipofuscin-filled RPE cells. These areas surrounding atrophy with FAF abnormalities are of particular interest as these changes precede cell death and, therefore, absolute scotoma.52 Longitudinal observations further suggest that the extension of the total area with increased FAF surrounding atrophy at baseline has a strong positive correlation with atrophy progression rate over time.53
Evaluating FAF abnormalities of the junctional zone in large patient cohorts, distinct phenotypes in the distribution and appearance of these areas have been identified, while it appears that there is a high degree of intra-individual symmetry.54,55 Based on these findings, the Fundus Autofluorescence in age-related Macular degeneration (FAM) Study Group has developed the classification of FAF patterns in the junctional zone of patients with GA secondary to AMD.56 A recent report indicates that eyes with the banded (median 1.81 mm2/year) and the diffuse FAF pattern (1.77 mm2/year) showed a more rapid enlargement compared with eyes without FAF abnormalities (0.38 mm2/year) and the focal FAF pattern (0.81 mm2/year) (Figure 3).50 Within the group of the diffuse pattern, eyes with a diffuse trickling pattern exhibited an even higher spread rate (median 3.02 mm2/year) compared to the other diffuse types (1.67 mm2/year). These phenotypic features of FAF abnormalities had a much stronger impact on atrophy progression than any other risk factor that has been addressed in previous studies on progression of GA due to AMD.
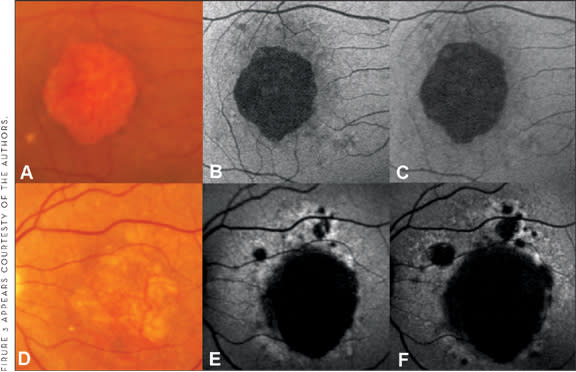
Figure 3. FAF imaging in geographic atrophy. A and D. Fundus photographs of 2 eyes with central geographic atrophy of similar size B. and E. Baseline FAF imaging revealing no FAF abnormalities in the junctional zone for the example in the upper line (B – none pattern) and diffuse FAF abnormalities for example in the lower line (F – diffuse pattern) C. and G. Follow-up FAF imaging showing enlargement of atrophic patches for both eyes. Atrophy progression for the eye with the none pattern (B, C) is demonstrated to a much lesser extent in comparison with the eye with the diffuse pattern (E, F) suggesting that the FAF pattern at baseline may serve as a predictive marker for future atrophy enlargement.
CONCLUSION
Several lines of evidence suggest that RPE dysfunction may play a role in the pathogenesis of AMD. FAF imaging represents a novel imaging method that allows topographic mapping of lipofuscin distribution and metabolic changes in the RPE cell monolayer in vivo. Understanding of basic principles, imaging devices, and the use of standardized protocols is important to evaluate and interpret FAF findings. In early AMD, most studies have focused on cross-sectional analysis and the data on longitudinal observations are limited. One study suggests that large FAF abnormalities in patients with soft drusen (labeled as the "patchy" pattern) may predispose to the development of CNV. In patients with GA, FAF abnormalities in the junctional zone may serve as disease markers to predict future atrophy progression. The diffuse and banded patterns represent high-risk features and allow for identification of rapid-progressors. These findings underscore the value of FAF imaging to clinical practice and to the understanding of the pathophysiology and potential treatment of retinal diseases. RP
REFERENCES
- Holz FG, Pauleikhoff D, Spaide RF, Bird AC. Age-related Macular Degeneration. 2nd ed. New York, NY: Springer; 2004.
- Klein R, Klein BE, Knudtson MD, Meuer SM, Swift M, Gangnon RE. Fifteen-year cumulative incidence of age-related macular degeneration: the Beaver Dam Eye Study. Ophthalmology. 2007;114:253-262.
- Wang JJ, Rochtchina E, Lee AJ, et al. Ten-year incidence and progression of age-related maculopathy: the blue Mountains Eye Study. Ophthalmology. 2007;114:92-98.
- Chakravarthy U, Augood C, Bentham GC, et al. Cigarette smoking and agerelated macular degeneration in the EUREYE Study. Ophthalmology. 2007.
- Tomany SC, Wang JJ, Van Leeuwen R, et al. Risk factors for incident agerelated macular degeneration: pooled findings from 3 continents. Ophthalmology. 2004;111:1280-1287.
- Klaver CC, Wolfs RC, Vingerling JR, Hofman A, de Jong PT. Age-specific prevalence and causes of blindness and visual impairment in an older population: the Rotterdam Study. Arch Ophthalmol. 1998;116:653-658.
- van Leeuwen R, Klaver CC, Vingerling JR, Hofman A, de Jong PT. Epidemiology of age-related maculopathy: a review. Eur J Epidemiol. 2003;18:845-854.
- Ambati J, Ambati BK, Yoo SH, Ianchulev S, Adamis AP. Age-related macular degeneration: etiology, pathogenesis, and therapeutic strategies. Surv Ophthalmol. 2003;48:257-293.
- Bird A. Age-related macular disease. Br J Ophthalmol. 1996;80:2-3.
- Holz FG, Pauleikhoff D, Klein R, Bird AC. Pathogenesis of lesions in late agerelated macular disease. Am J Ophthalmol. 2004;137:504-510.
- Sparrow JR, Boulton M. RPE lipofuscin and its role in retinal pathobiology. Exp Eye Res. 2005;80:595-606.
- Weiter JJ, Delori FC, Wing GL, Fitch KA. Retinal pigment epithelial lipofuscin and melanin and choroidal melanin in human eyes. Invest Ophthalmol Vis Sci. 1986;27:145-152.
- Wing GL, Blanchard GC, Weiter JJ. The topography and age relationship of lipofuscin concentration in the retinal pigment epithelium. Invest Ophthalmol Vis Sci. 1978;17:601-607.
- Feeney-Burns L, Berman ER, Rothmann H. Lipofuscin of human retinal pigment epithelium. Am J Ophthalmol. 1980;90:783-791.
- Eldred GE, Lasky MR. Retinal age-pigments generated by self-assembling lysosomotrophic detergents. Nature. 1993;361:724-726.
- Dorey CK, Wu G, Ebenstein D, Garsd A, Weiter JJ. Cell loss in the aging retina. Relationship to lipofuscin accumulation and macular degeneration. Invest Ophthalmol Vis Sci. 1989;30:1691-1699.
- Bui TV, Han Y, Radu RA, Travis GH, Mata NL. Characterization of native retinal fluorophores involved in biosynthesis of A2E and lipofuscin-associated retinopathies. J Biol Chem. 2006;281:18112-18119.
- Okubo A, Rosa RH, Jr., Bunce CV, et al. The relationships of age changes in retinal pigment epithelium and Bruch's membrane. Invest Ophthalmol Vis Sci. 1999;40:443-449.
- Schutt F, Davies S, Kopitz J, Holz FG, Boulton ME. Photodamage to human RPE cells by A2-E, a retinoid component of lipofuscin. Invest Ophthalmol Vis Sci. 2000;41:2303-2308.
- Bergmann M, Schutt F, Holz FG, Kopitz J. Inhibition of the ATP-driven proton pump in RPE lysosomes by the major lipofuscin fluorophore A2-E may contribute to the pathogenesis of age-related macular degeneration. Faseb J. 2004;18:562-564.
- Kopitz J, Holz FG, Kaemmerer E, Schutt F. Lipids and lipid peroxidation products in the pathogenesis of age-related macular degeneration. Biochimie. 2004;86:825-831.
- Holz FG, Schutt F, Kopitz J, et al. Inhibition of lysosomal degradative functions in RPE cells by a retinoid component of lipofuscin. Invest Ophthalmol Vis Sci. 1999;40:737-743.
- Brunk UT, Wihlmark U, Wrigstad A, Roberg K, Nilsson SE. Accumulation of lipofuscin within retinal pigment epithelial cells results in enhanced sensitivity to photo-oxidation. Gerontology. 1995;41(Suppl 2):201-212.
- Hammer M, Richter S, Guehrs KH, Schweitzer D. Retinal pigment epithelium cell damage by A2-E and its photo-derivatives. Mol Vis 2006;12:1348-1354.
- Lamb LE, Simon JD. A2E: a component of ocular lipofuscin. Photochem Photobiol. 2004;79:127-136.
- Marmorstein AD, Marmorstein LY, Sakaguchi H, Hollyfield JG. Spectral profiling of autofluorescence associated with lipofuscin, Bruch's Membrane, and sub- RPE deposits in normal and AMD eyes. Invest Ophthalmol Vis Sci. 2002;43:2435-2441.
- Delori FC, Dorey CK, Staurenghi G, Arend O, Goger DG, Weiter JJ. In vivo fluorescence of the ocular fundus exhibits retinal pigment epithelium lipofuscin characteristics. Invest Ophthalmol Vis Sci. 1995;36:718-729.
- von Ruckmann A, Fitzke FW, Bird AC. Distribution of fundus autofluorescence with a scanning laser ophthalmoscope. Br J Ophthalmol. 1995;79:407-412.
- American National Standard for the Safe Use of Lasers: ANSI Z136.1. In: Institute ANS. Orlando, FL: Laser Institute of America, 2000.
- Spaide RF. Fundus autofluorescence and age-related macular degeneration. Ophthalmology. 2003;110:392-399.
- Katz ML, Robison WG, Jr. What is lipofuscin? Defining characteristics and differentiation from other autofluorescent lysosomal storage bodies. Arch Gerontol Geriatr. 2002;34:169-184.
- Liu J, Itagaki Y, Ben-Shabat S, Nakanishi K, Sparrow JR. The biosynthesis of A2E, a fluorophore of aging retina, involves the formation of the precursor, A2-PE, in the photoreceptor outer segment membrane. J Biol Chem. 2000;275:29354-29360.
- Holz FG, Schmitz-Valckenberg S, Spaide RF, Bird AC. Atlas of Fundus Autofluorescence Imaging. Berlin, Germany: Springer; 2007.
- Bellmann C, Holz FG, Schapp O, Volcker HE, Otto TP. [Topography of fundus autofluorescence with a new confocal scanning laser ophthalmoscope]. Ophthalmologe. 1997;94:385-391.
- Lois N, Owens SL, Coco R, Hopkins J, Fitzke FW, Bird AC. Fundus autofluorescence in patients with age-related macular degeneration and high risk of visual loss. Am J Ophthalmol. 2002;133:341-349.
- Spital G, Radermacher M, Muller C, Brumm G, Lommatzsch A, Pauleikhoff D. [Autofluorescence characteristics of lipofuscin components in different forms of late senile macular degeneration]. Klin Monatsbl Augenheilkd. 1998; 213:23-31.
- Solbach U, Keilhauer C, Knabben H, Wolf S. Imaging of retinal autofluorescence in patients with age-related macular degeneration. Retina. 1997;17:385-389.
- von Ruckmann A, Fitzke FW, Bird AC. Fundus autofluorescence in age-related macular disease imaged with a laser scanning ophthalmoscope. Invest Ophthalmol Vis Sci. 1997;38:478-486.
- von Ruckmann A, Schmidt KG, Fitzke FW, Bird AC, Jacobi KW. [Dynamics of accumulation and degradation of lipofuscin in retinal pigment epithelium in senile macular degeneration]. Klin Monatsbl Augenheilkd. 1998;213:32-37.
- Smith RT, Chan JK, Busuoic M, Sivagnanavel V, Bird AC, Chong NV. Autofluorescence characteristics of early, atrophic, and high-risk fellow eyes in age-related macular degeneration. Invest Ophthalmol Vis Sci. 2006; 47:5495-5504.
- Bindewald A, Bird AC, Dandekar SS, et al. Classification of fundus autofluorescence patterns in early age-related macular disease. Invest Ophthalmol Vis Sci. 2005;46:3309-3314.
- McBain VA, Townend J, Lois N. Fundus autofluorescence in exudative agerelated macular degeneration. Br J Ophthalmol. 2006;91:491-496.
- Einbock W, Moessner A, Schnurrbusch UE, Holz FG, Wolf S. Changes in fundus autofluorescence in patients with age-related maculopathy. Correlation to visual function: a prospective study. Graefes Arch Clin Exp Ophthalmol. 2005;243:300-305.
- Sarks SH. Drusen patterns predisposing to geographic atrophy of the retinal pigment epithelium. Aust J Ophthalmol. 1982;10:91-97.
- Blair CJ. Geographic atrophy of the retinal pigment epithelium. A manifestation of senile macular degeneration. Arch Ophthalmol. 1975;93:19-25.
- Maguire P, Vine AK. Geographic atrophy of the retinal pigment epithelium. Am J Ophthalmol. 1986;102:621-625.
- Schatz H, McDonald HR. Atrophic macular degeneration. Rate of spread of geographic atrophy and visual loss. Ophthalmology. 1989;96:1541-1551.
- Sunness JS, Gonzalez-Baron J, Applegate CA, et al. Enlargement of atrophy and visual acuity loss in the geographic atrophy form of age-related macular degeneration. Ophthalmology. 1999;106:1768-1779.
- Sunness JS. The natural history of geographic atrophy, the advanced atrophic form of age-related macular degeneration. Mol Vis. 1999;5:25.
- Holz FG, Bindewald-Wittich A, Fleckenstein M, Dreyhaupt J, Scholl H, S. S-V. Progression of geographic atrophy and impact of fundus autofluorescence patterns in age-related macular degeneration. Am J Ophthalmol. 2007; 143:463-472.
- Sunness J, Margalit E, Srikurnaran D, et al. The long-term natural history of geographic atrophy from age-related macular degeneration. Ophthalmology. 2007;114:271-277.
- Holz FG, Bellman C, Staudt S, Schutt F, Volcker HE. Fundus autofluorescence and development of geographic atrophy in age-related macular degeneration. Invest Ophthalmol Vis Sci. 2001;42:1051-1056.
- Schmitz-Valckenberg S, Bindewald-Wittich A, Dolar-Szczasny J, et al. Correlation between the area of increased autofluorescence surrounding geographic atrophy and disease progression in patients with AMD. Invest Ophthalmol Vis Sci. 2006;47:2648-2654.
- Holz FG, Bellmann C, Margaritidis M, Schutt F, Otto TP, Volcker HE. Patterns of increased in vivo fundus autofluorescence in the junctional zone of geographic atrophy of the retinal pigment epithelium associated with age-related macular degeneration. Graefes Arch Clin Exp Ophthalmol. 1999;237:145-152.
- Bellmann C, Jorzik J, Spital G, Unnebrink K, Pauleikhoff D, Holz FG. Symmetry of bilateral lesions in geographic atrophy in patients with age-related macular degeneration. Arch Ophthalmol. 2002;120:579-584.
- Bindewald A, Schmitz-Valckenberg S, Jorzik JJ, et al. Classification of abnormal fundus autofluorescence patterns in the junctional zone of geographic atrophy in patients with age related macular degeneration. Br J Ophthalmol. 2005;89:874-878.


