What Is the Gold Standard for Retinal Imaging?
BRANDON J. LUJAN, MD, & PHILIP J. ROSENFELD, MD, PhD
Over the next several years, spectral-domain-optical coherence tomography (SD-OCT), also known as Fourier-domain OCT or high-definition OCT, will likely become the gold standard for retinal imaging. Currently, fluorescein angiography (FA) and time-domain (Stratus, Carl Zeiss Meditec, Dublin, Calif) OCT play complementary roles in the evaluation and management of retinal diseases. The greatest limitation of OCT is that it is a static imaging technique that does not yet have the resolution to directly image blood vessels, particularly capillaries and choroidal neovascularization. In contrast, FA is more of a dynamic imaging modality able to visualize active leakage and the fine vascular components of the retina.
Fluorescein angiography will continue to play a critical role in the diagnosis and management of certain retinal diseases; however, the list of these diseases will become increasingly shorter. Invented somewhat serendipitously by Novotny and Alvis, a medical student and intern, respectively, the original publication of the technique appeared in Circulation, having been turned down by the American Journal of Ophthalmology.1 After this technique became popularized, the study of retinal disease progressed from that of observation to that of comprehension. FA led the way for an unprecedented appreciation of diabetic macular edema (DME), age-related macular degeneration (AMD), and many other diseases. FA redefined the study and the specialty of retina.
The evolution of OCT has recapitulated the evolution of FA. First reported by Huang and colleagues2, the development of OCT again revolutionized the field of retinal imaging. OCT allowed the clinician for the first time to noninvasively acquire tomographic ultrastructural data of the macula. Several studies of AMD and DME have shown a high correspondence between findings of leakage on FA and the presence of intraretinal or subretinal fluid on OCT.3,4 However, the distribution of retinal edema yielded some surprising results when observing the exact anatomical location of fluid compared to what the FA would suggest.5 Indeed, the location of fluid in the retina can be markedly different from the location predicted from FA, thus showing the limitation of FA. In addition, Eter and Spaide5 noted that while fluorescein may eventually leak into some subretinal and intraretinal spaces, one must wait at least 20 minutes to appreciate this, something not practical in many modern practices. Indeed the speed of OCT along with its noninvasiveness should not be understated from a patient’s perspective, and scans at each visit to monitor disease progression can be valuable in the management of retinal disease.
| Philip J. Rosenfeld, MD, PhD, is professor of ophthalmology at Bascom Palmer Eye Institute in Miami. Brandon J. Lujan, MD, is a medical retina fellow at Bascom Palmer. Dr. Rosenfeld serves on Genentech’s advisory board and speakers’ bureau and has received clinical research funding from Genentech. |
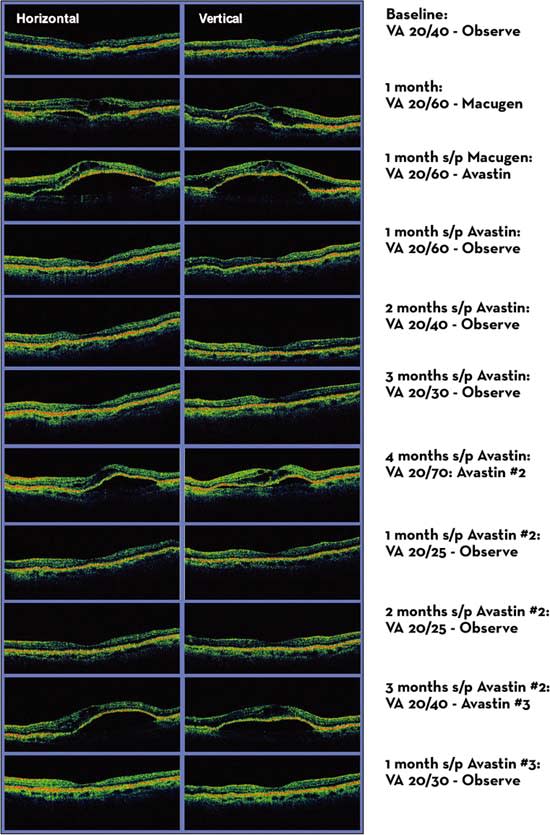
An example of how OCT can be used to monitor patients with neovascular AMD can be found in the Prospective OCT imaging of patients with Neovascular AMD Treated with Intra-Ocular Ranibizumab (PrONTO) study. The PrONTO study used OCT to guide treatment with intravitreal ranibizumab (Lucentis, Genentech). OCT was performed on every patient in this study at each visit, and it was used to decide whether a reinjection was performed. After 3 scheduled injections at monthly intervals, patients were reinjected based on quantitative and qualitative OCT changes detected from 1 month to the next. If a previously observed patient had a change in the amount of intraretinal or subretinal fluid on OCT, or if a previously treated patient had any residual fluid present from the previous month’s injection, ranibizumab was injected. One-year results from this variable dosing study have shown similar efficacy compared with the phase 2 fixed monthly injections.6 As more experience is gained using OCT imaging to direct intravitreal injections, we will further refine our strategies on treating patients so that longer fluid-free intervals can be achieved. Figure 1 shows an example of how this strategy may be implemented in the routine care of patients.

Figure 1. Anti-VEGF treatment in neovascular AMD guided by the presence of intraretinal and subretinal fluid on OCT.
THE FUTURE: SPECTRAL DOMAIN OCT
While the current time-domain OCT is very useful, its full potential has not yet been realized. OCT acquisition speed is currently limited by the need for a mechanical reference arm in order to assess retinal depth using interferometry. This is the mechanism of Stratus OCT, and typically results in the generation of six 6-mm slices through the macula each offset by 30°. While this yields highly useful information, the limited sampling of the macula can miss pathology because of the gaps between slices. Additionally, the dynamic nature of fluid and the state of vascular perfusion cannot be readily determined, therefore necessitating FA. Truly, these different technologies work in a complementary fashion, and neither could be said to be superior as a stand-alone product.

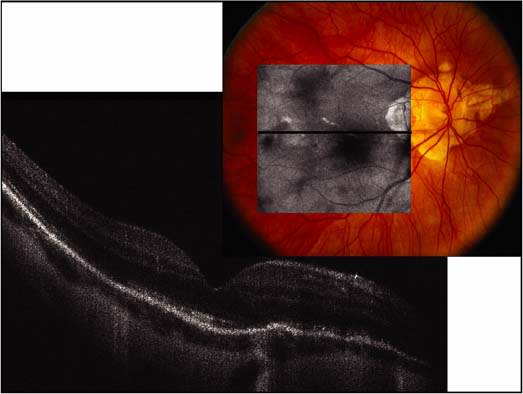
Figure 2. Spectral Domain-OCT of a myopic fundus with prominent hyperreflective transmission through lacquer cracks and irregularities in the photoreceptor layer.
Spectral domain-OCT will change this status quo. SD-OCT has several distinct advantages over the Stratus OCT. Due to the absence of moving parts because the interference from coherent light is assessed by mathematical manipulations, a 256 x 256 raster scan can be performed in less time than the 6-line scans of Stratus OCT and the entire macula is sampled. This pattern of data acquisition acquires a 6 mm x 6 mm volume of tissue rather than sampling just 6 slices. Additionally the axial resolution is improved compared with the Stratus OCT. This scanning strategy permits the reconstruction of a virtual “fundus photo” of the retina from the individual OCT B-scans. Consequently, the exact location of macular pathology can be correlated with retinal landmarks. Registration of subsequent scans can be achieved by lining up blood vessels or other retinal landmarks, and disease progression can be monitored by reproducibly sampling the same areas of the retina at each visit. As improved light sources become available, improved axial resolution will be obtained, leading to a further improvement in our ability to identify pathology (Figure 2).
While OCT and FA are now used as complementary imaging modalities, we predict that SD-OCT will rapidly supersede FA as a tool for diagnosis and treatment of retinal diseases. This will occur rapidly as retina physicians come to appreciate the speed, reliability, and reproducibility of SD-OCT. Most importantly, they will enjoy the benefits of higher OCT image resolution along with better algorithms to achieve segmentation and quantitation, as well as the ability to create 3-D volumetric reconstructions of the macula and achieve point-to-point correlation between these OCT images and a reconstructed fundus images. Now, the physician will be able to obtain a true optical biopsy of the fundus.
As analyses of volumetric data acquired by the SD-OCT become more sophisticated, the accurate quantification of edema, drusen, pigment epithelial detachments, and geographic atrophy will become possible. As the number of therapeutic interventions for AMD and macular edema increase, we believe this improved quantification will be useful to determine the progression of disease so that SD-OCT images will be used as clinical endpoint to assess the most effective treatments. Future improvements in SD-OCT will also include an enhanced ability to image the choroidal vasculature and possibly the ability to dynamically image blood flow. As SD-OCT becomes more widely available and data analysis continues to improve, FA for retinal diseases will never disappear, but its use will surely diminish over time. RP
REFERENCES
1. Norton EW. Doyne memorial lecture, 1981. Fluorescein angiography. Twenty years later. Trans Ophthalmol Soc U K. 1981;101(Pt 2):229–233.
2. Huang D, Swanson EA, Lin CP, et al. Optical coherence tomography. Science. 1991;254:1178–1181.
3. Kang SW, Park CY, Ham DI. The correlation between fluorescein angiographic and optical coherence tomographic features in clinically significant diabetic macular edema. Am J Ophthalmol. 2004;137:313–322.
4. Van de Moere A, Sandhu SS, Talks SJ. Correlation of optical coherence tomography and fundus fluorescein angiography following photodynamic therapy for choroidal neovascular membranes. Br J Ophthalmol. 2006;90:304–306.
5. Eter N, Spaide RF. Comparison of fluorescein angiography and optical coherence tomography for patients with choroidal neovascularization after photodynamic therapy. Retina. 2005;25:691–696.
6. Fung AE, Lalwani GA, Rosenfeld PJ, et al. An OCT guided, variable dosing regimen with intravitreal ranibizumab (Lucentis) for neovascular age-related macular degeneration. Am J Ophthalmology. 2007;143. In press.


